
Swing Highs and Swing Lows
Swing Highs and Swing Lows are the foundation for all price action analysis strategies. They tell us where the strength between buyers and sellers reversed.
What are Swing Highs and Swing Lows?
Swing Highs and Swing Lows are used to determine the strength of buyers and sellers in the market.
They are the most important concept when it comes to analysing and understanding how the market structure of a chart is developing.
A Swing High is created when an upward move stalls, loses its strength, and begins to then move lower.
A Swing Low is created when a downward move stalls, loses its strength, and begins to then move higher.
How to identify Swing Highs and Swing Lows
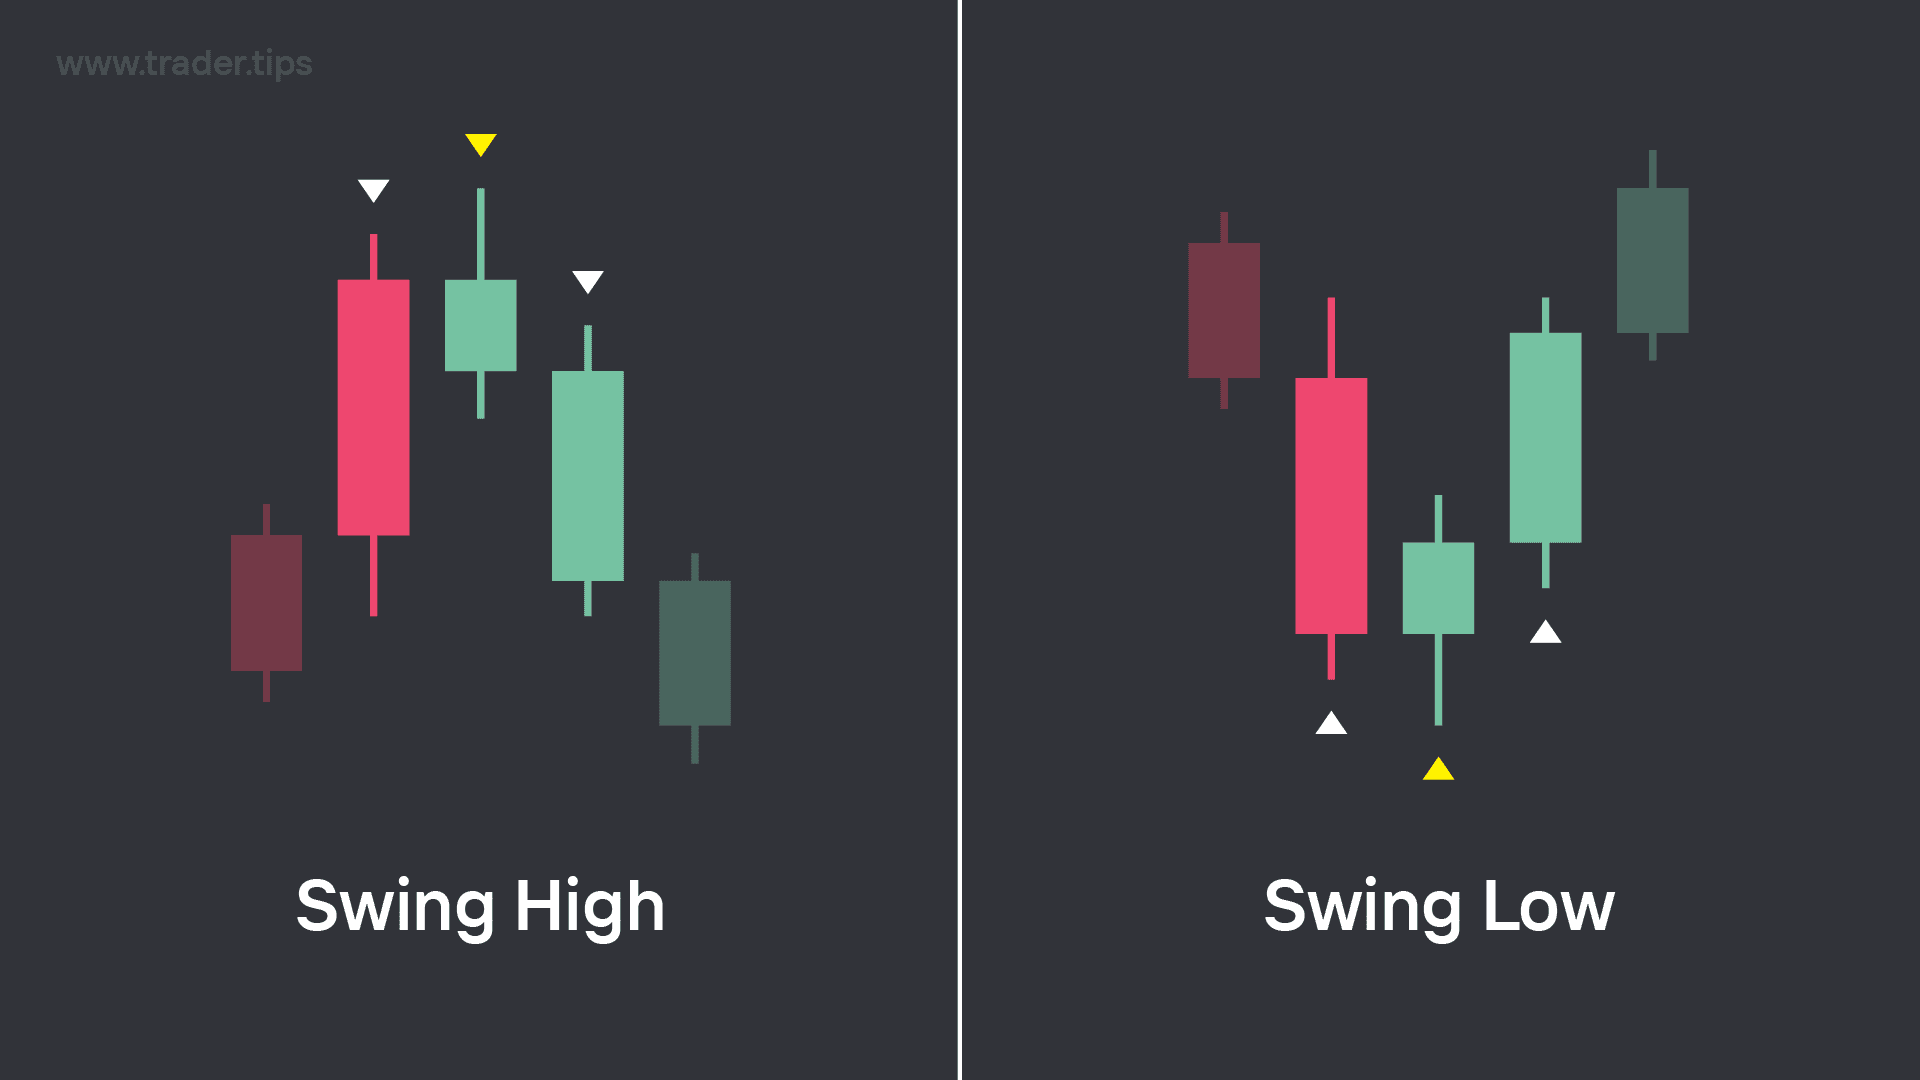
Example of a Swing High and a Swing Low.
Swing High
A Swing High is technically a 3 candle pattern that is formed when a candle's top wick is higher than the top wicks of both the candles to it's left and to it's right.
This signals that the 'peak' of buying pressure has been reached (at least for the moment) and sellers are now gaining strength to push the price back lower.
What happens when a Swing High Forms:
Loss in buying momentum
Increase in selling pressure
Price direction rotates from upwards to downwards
Swing Low
A Swing Low is technically a 3 candle pattern that is formed when a candle's bottom wick is lower than the bottom wicks of both the candles to it's left and to it's right.
This signals that the 'peak' of selling pressure has been reached (at least for the moment) and buyers are now gaining strength to push the price back higher.
What happens when a Swing Low Forms:
Loss in selling momentum
Increase in buying pressure
Price direction rotates from downwards to upwards
What are Swing Highs and Swing Lows used for?
Swing Highs and Swing Lows are used as pivot points in the charts.
We use them in traditional analysis to identify uptrends and downtrends.
In Smart Money Concepts, Swing Highs and Swing Lows are where the market forms liquidity that is targeted by institutions for filling their large trade orders.
Swing Highs and Swing Lows will be mentioned a lot through the rest of the course as they are the fundamental concept for all technical analysis.