Candlesticks
Candlesticks are used as a tool for reading the price movements of an asset on a trading chart.
What is a candlestick chart?
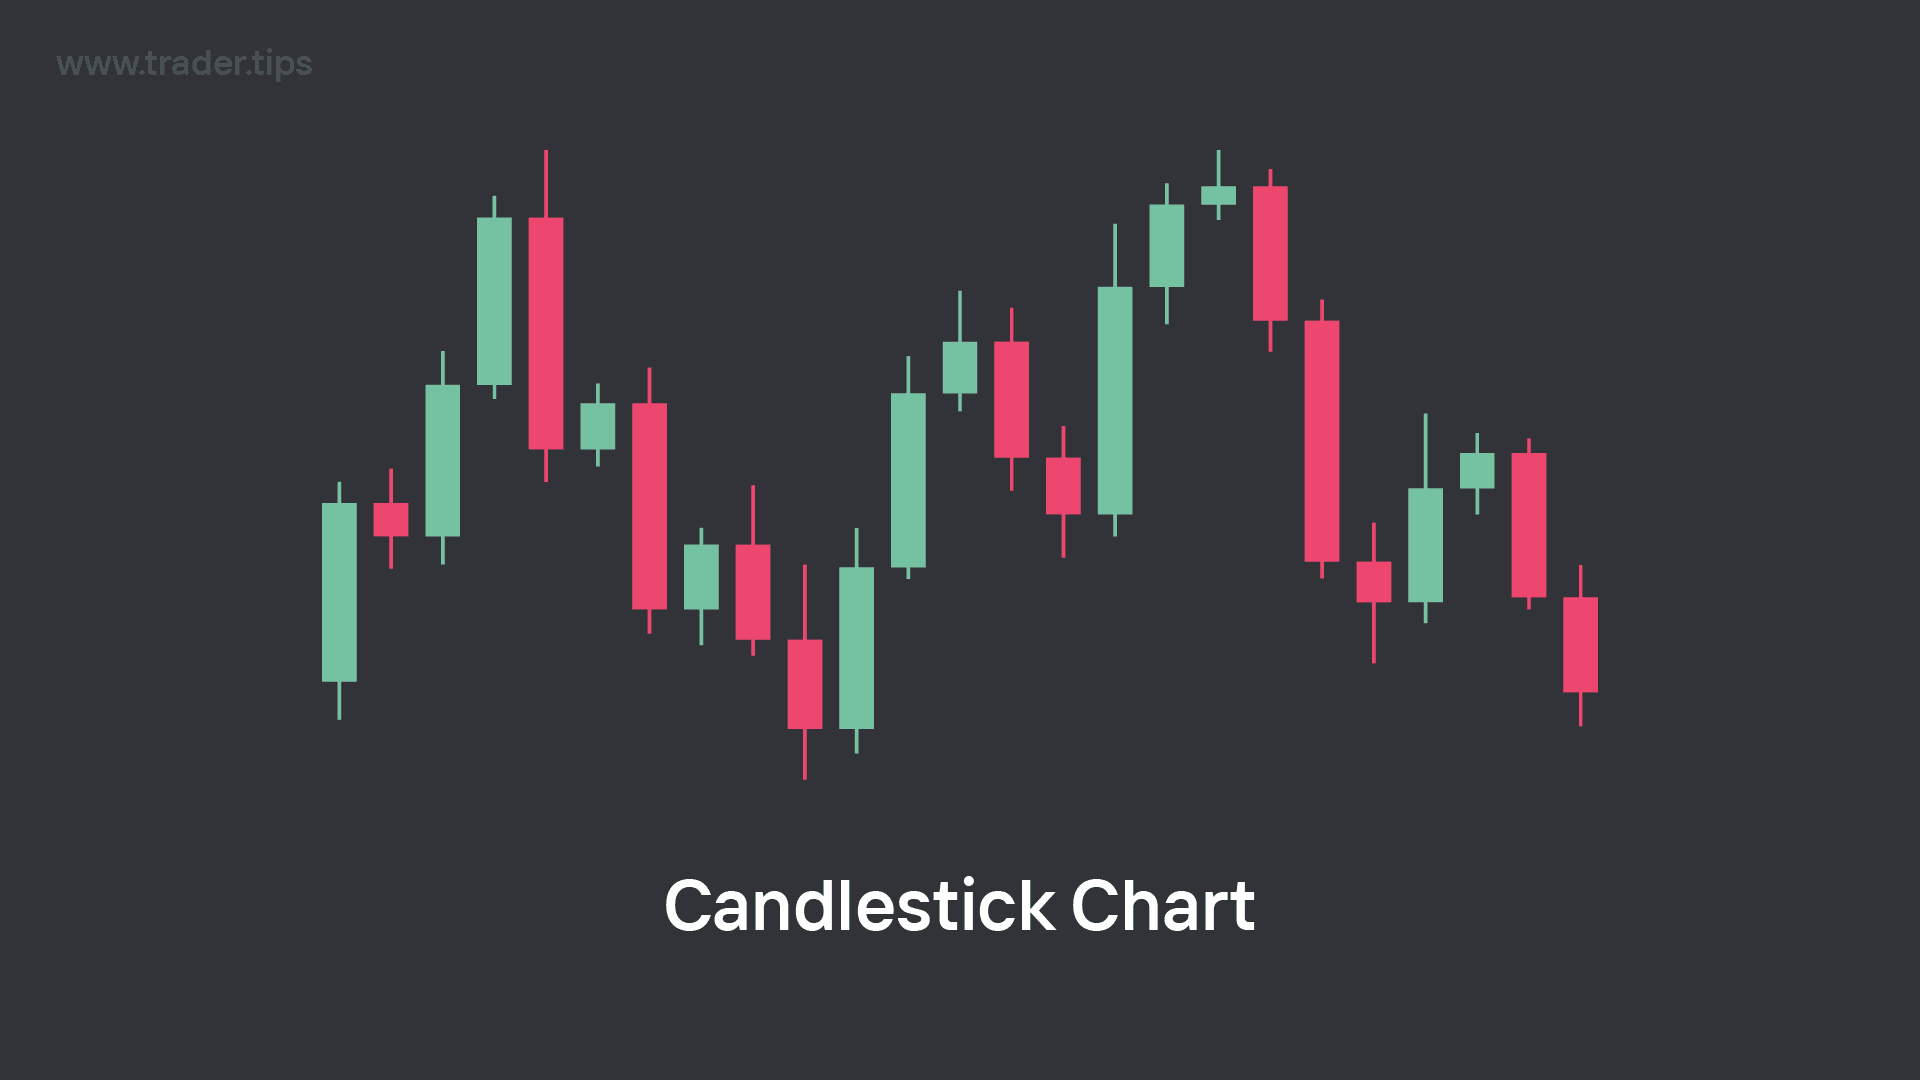
Example of a Candlestick Chart.
A candlestick chart is used to visualise the market price movements of an asset.
They are made up of many individual 'candlesticks', which together form the overall architecture of the candlestick chart.
What are candlesticks in trading?
A candlestick visualises how an asset's price has changed over a specific length of time.
In simple terms, we use them to easily see whether an asset is 'going up' or 'going down' in value.
'Candlesticks' are commonly referred to as 'Candles'.
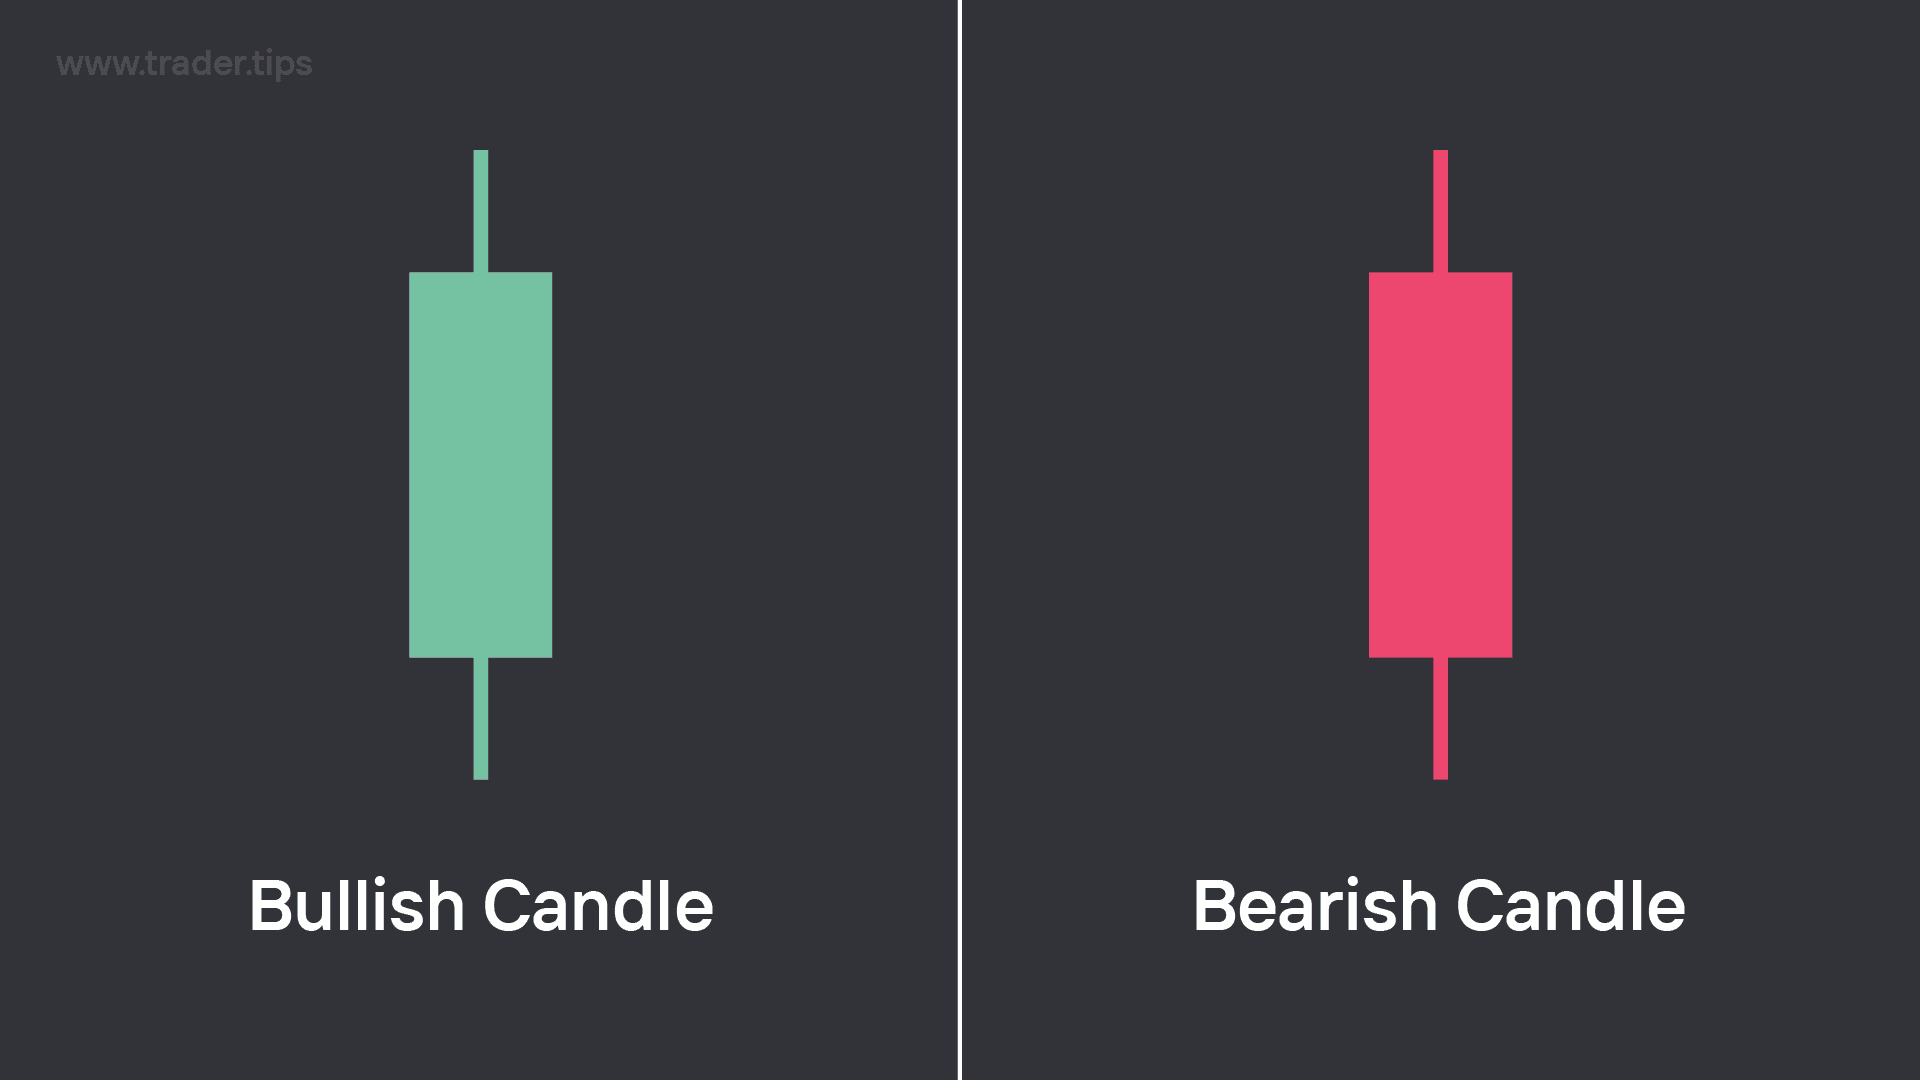
Example of a Bullish Candlestick and a Bearish Candlestick.
The market can only move in 2 directions, either up or down. This means that there are only 2 variations of a candlestick, which are easily identifiable by their colours:
Bullish Candlestick:
Typically green in colour, a bullish candlestick is created when the price has increased over the span of time between when the candlestick opened, and when it closed.
Bearish Candlestick:
Typically red in colour, a bearish candlestick is created when the price has decreased over the span of time between when the candlestick opened, and when it closed.
What are Candlestick Bodies and Wicks?
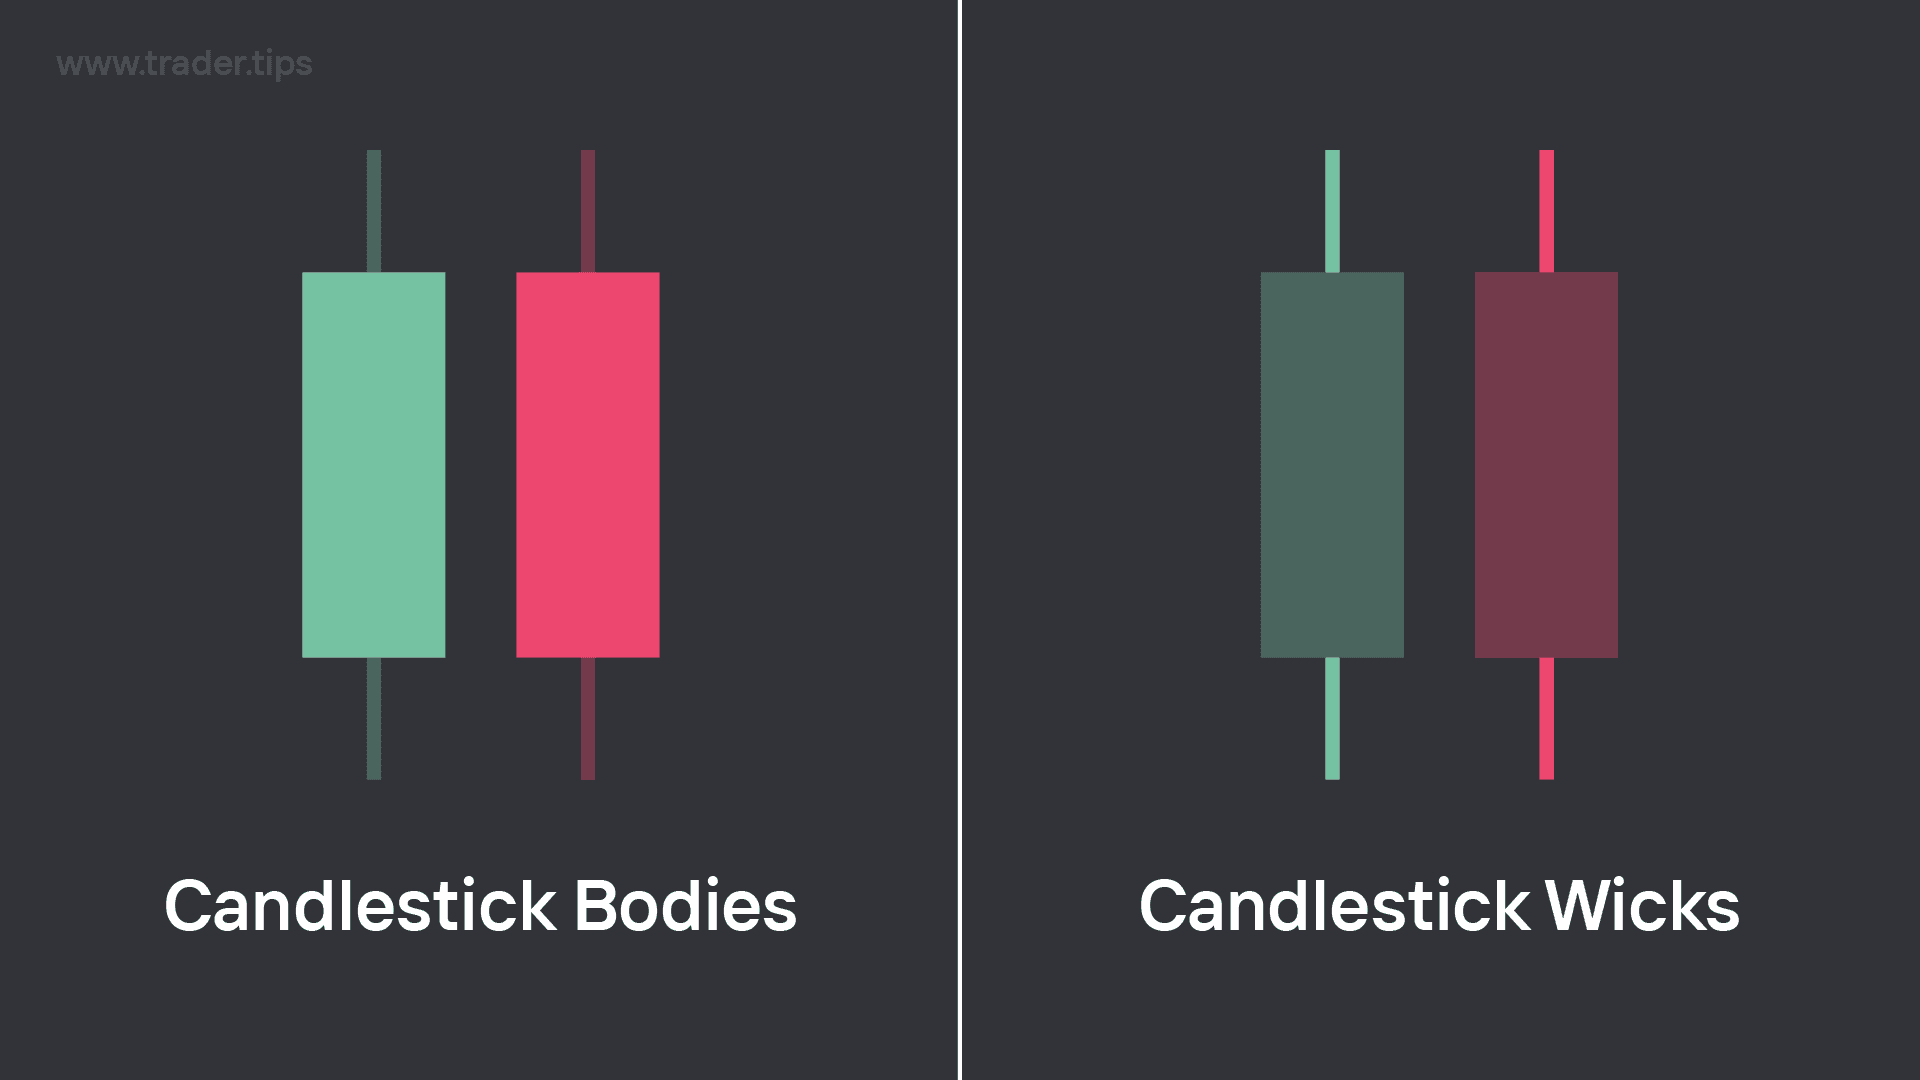
Candlestick Bodies and Candlestick Wicks of a bullish candle and a bearish candle.
Each candlestick contains 3 parts:
Candlestick Body:
A candlestick's body represents the change in price between when the candle 'opened', and when it 'closed'. The body holds 2 price data points, which are the Open Price (O), and the Close Price (C).
Top Wick:
A candlestick's top wick tells us the highest price that was reached during that candle's duration (the timespan between the candle's open and close). The top wick holds 1 price data point, which is the High Price (H).
Bottom Wick:
A candlestick's bottom wick tells us the lowest price that was reached during that candle's duration (the timespan between the candle's open and close). The bottom wick holds 1 price data point, which is the Lowest Price (L).
Opens, Highs, Lows and Closes
Candlesticks display 4 data points for how the price has changed during a specific span of time:
The Open Price (O):
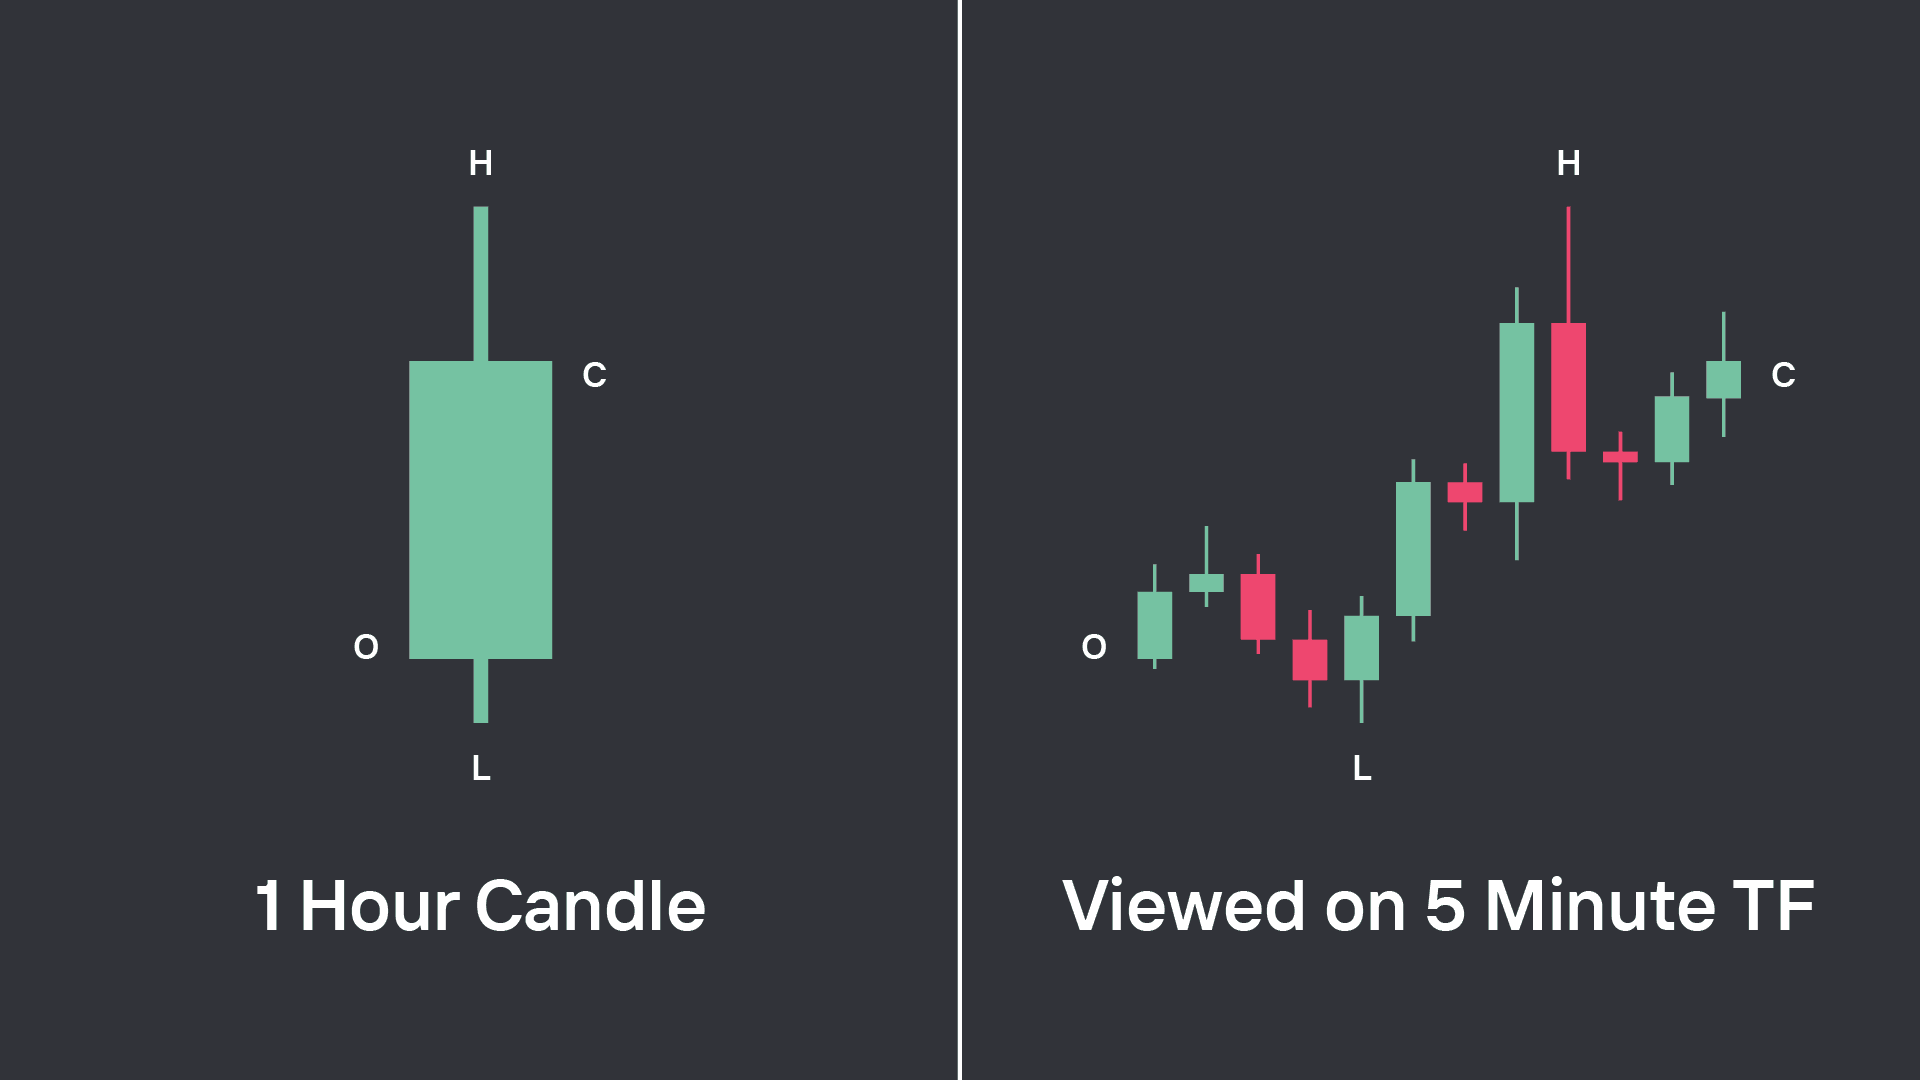
The market value of the asset when the candlestick opened. If we have a 1 hour candlestick, the open price would indicate the price of an asset when a new hour has started.
The Close Price (C):
The market value of the asset when the candlestick closed. If we have a 1 hour candlestick, the close price would indicate the price of an asset when the hour had ended.
The High Price (H):
The highest market value that was reached during the candlestick's duration. If we have a 1 hour candlestick, the high price would reflect the absolute highest price that the asset reached during that hour in time.
The Low Price (L):
The lowest market value that was reached during the candlestick's duration. If we have a 1 hour candlestick, the low price would reflect the absolute lowest price that the asset reached during that hour in time.
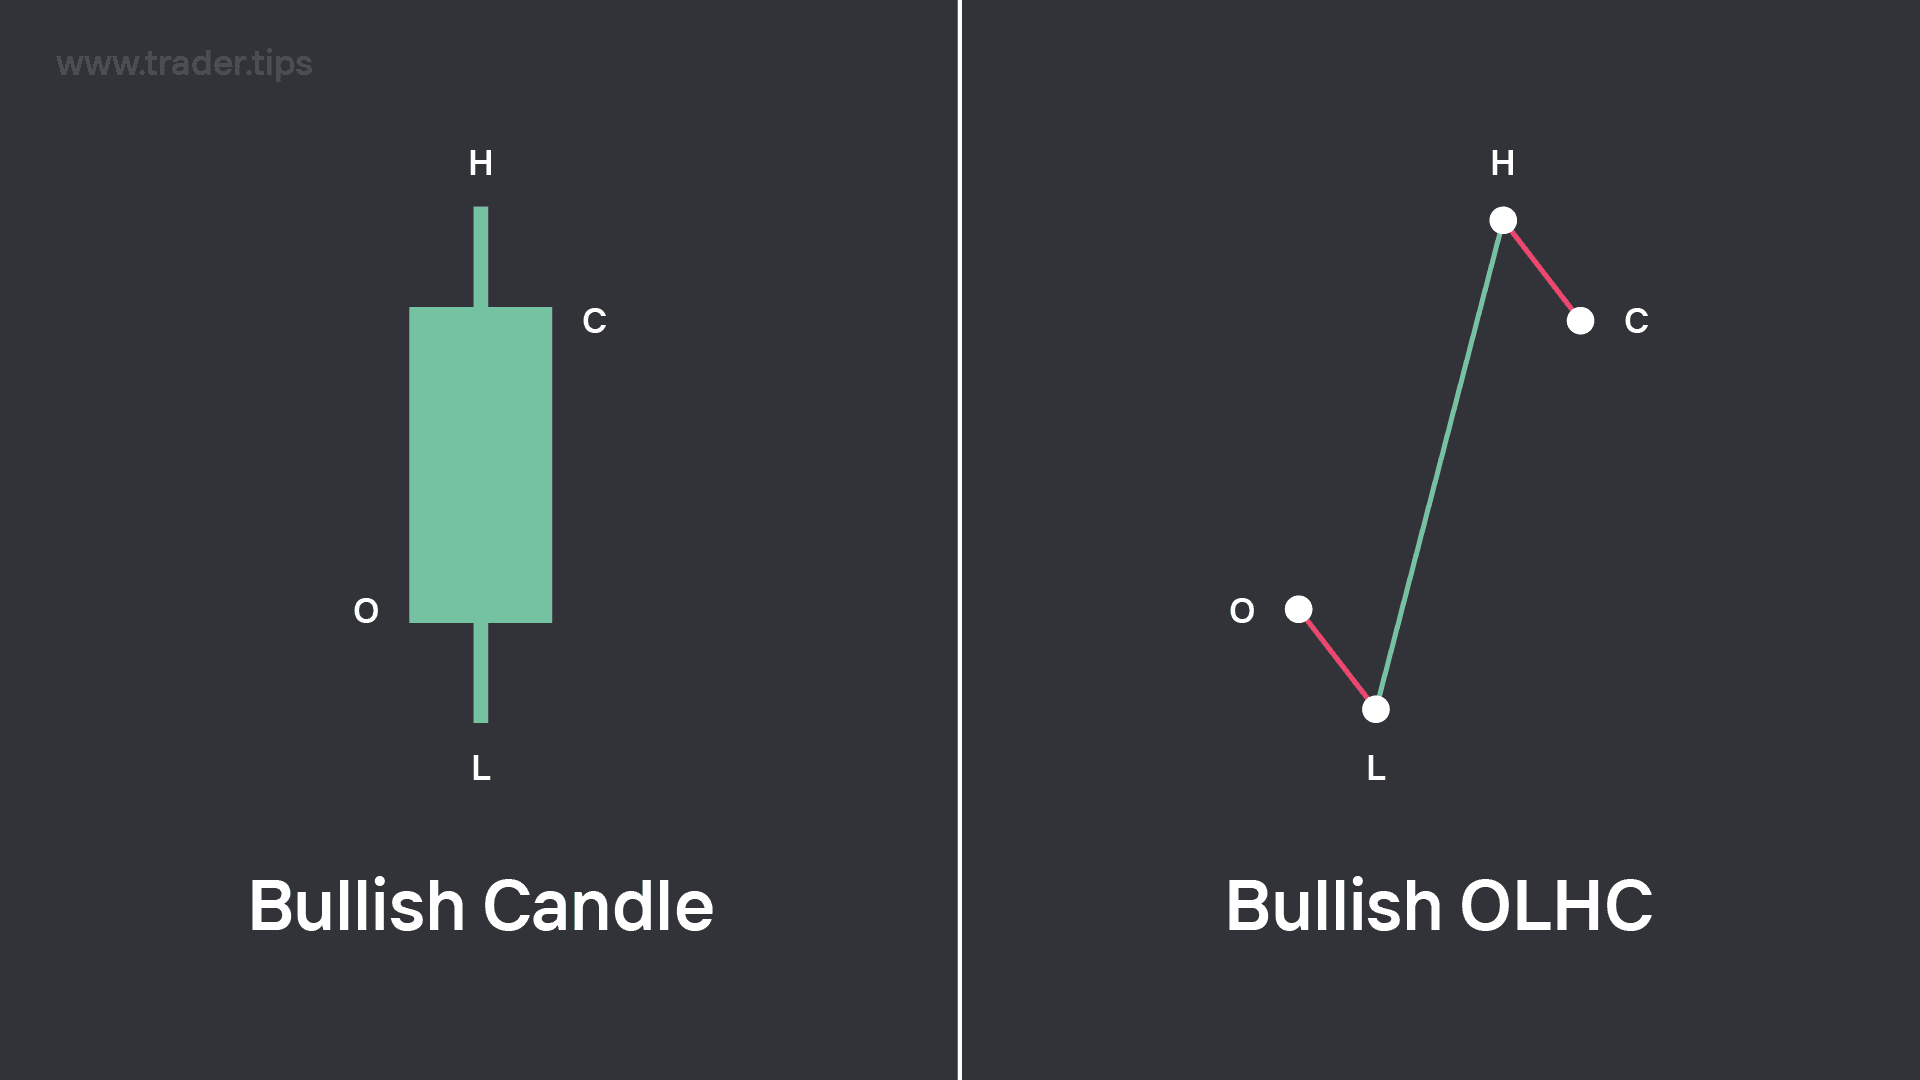
Example of an OLHC of a bullish candle.
A bullish candlestick signals that the market price of an asset increased during the period between when the candlestick opened and when it closed.
A bullish candlestick will typically follow an OLHC structure, which is where the candlestick opens, creates a shallow move down to create the low of the candlestick, before then pushing higher where it creates the high of the candlestick, before then finally closing at a price higher than that of the open price.
Criteria for the creation of a bullish candlestick:
A bullish candlestick forms when the market price of the asset is higher at the close (C) of the candlestick, when compared to that of the market value of when the candlestick opened (O).
Which in simple terms means that, if we have a 1 hour bullish candlestick, during the 1 hour between when that candlestick opened and closed, the market price of the asset had increased in value.
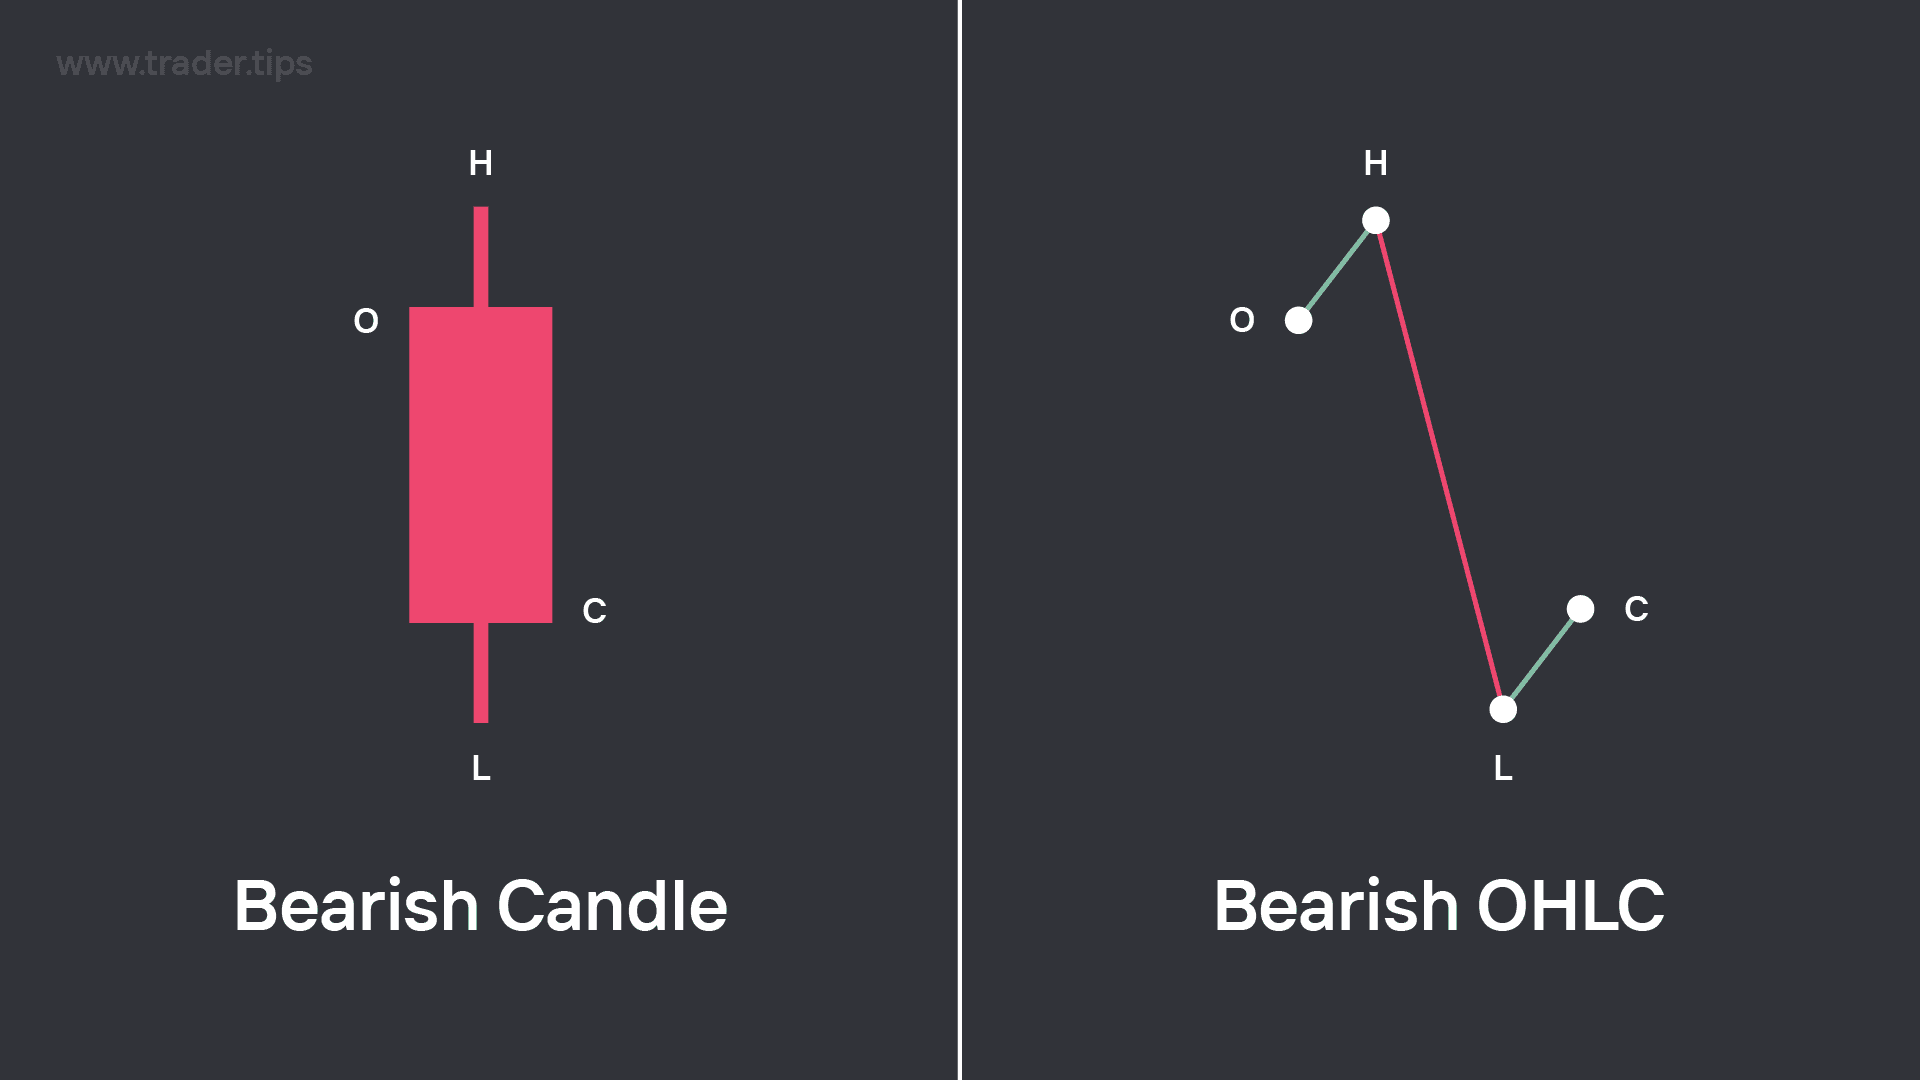
Example of an OHLC of a bearish candle.
A bearish candlestick signals that the market price of an asset decreased during the period between when the candlestick opened and when it closed.
A bearish candlestick will typically follow an OHLC structure, which is where the candlestick opens, creates a shallow move up to create the high of the candlestick, before then pushing lower where it creates the low of the candlestick, before then finally closing at a price lower than that of the open price.
Criteria for the creation of a bearish candlestick:
A bearish candlestick forms when the market price of the asset is lower at the close (C) of the candlestick when compared to that of the market value of when the candlestick opened (O).
Which in simple terms means that, if we have a 1 hour bearish candlestick, during the 1 hour between when that candlestick opened and closed, the market price of the asset had decreased in value.
This is the basics of candlesticks, which will be covered further in the timeframes section of the course.