
External Range Liquidity
Institutions that need a huge amount of volume to match their trades, look for liquidity.
What is External Range Liquidity?
External Range Liquidity is usually referred to by SMC traders as just 'Liquidity'.
Every trade we take using Smart Money Concepts is based on finding the 'Draw on Liquidity' target, which is where resting liquidity is positioned.
Liquidity is the most important concept when it comes to SMC trading because without it, we simply wouldn't have any setups to trade.
What is a 'Draw on Liquidity'?
Institutions always have a target for where they want the price to move to.
When we believe we have an idea on where we think the institutes want to deliver price to, we call this the 'Draw on Liquidity'.
Swing High and Swing Low Liquidity
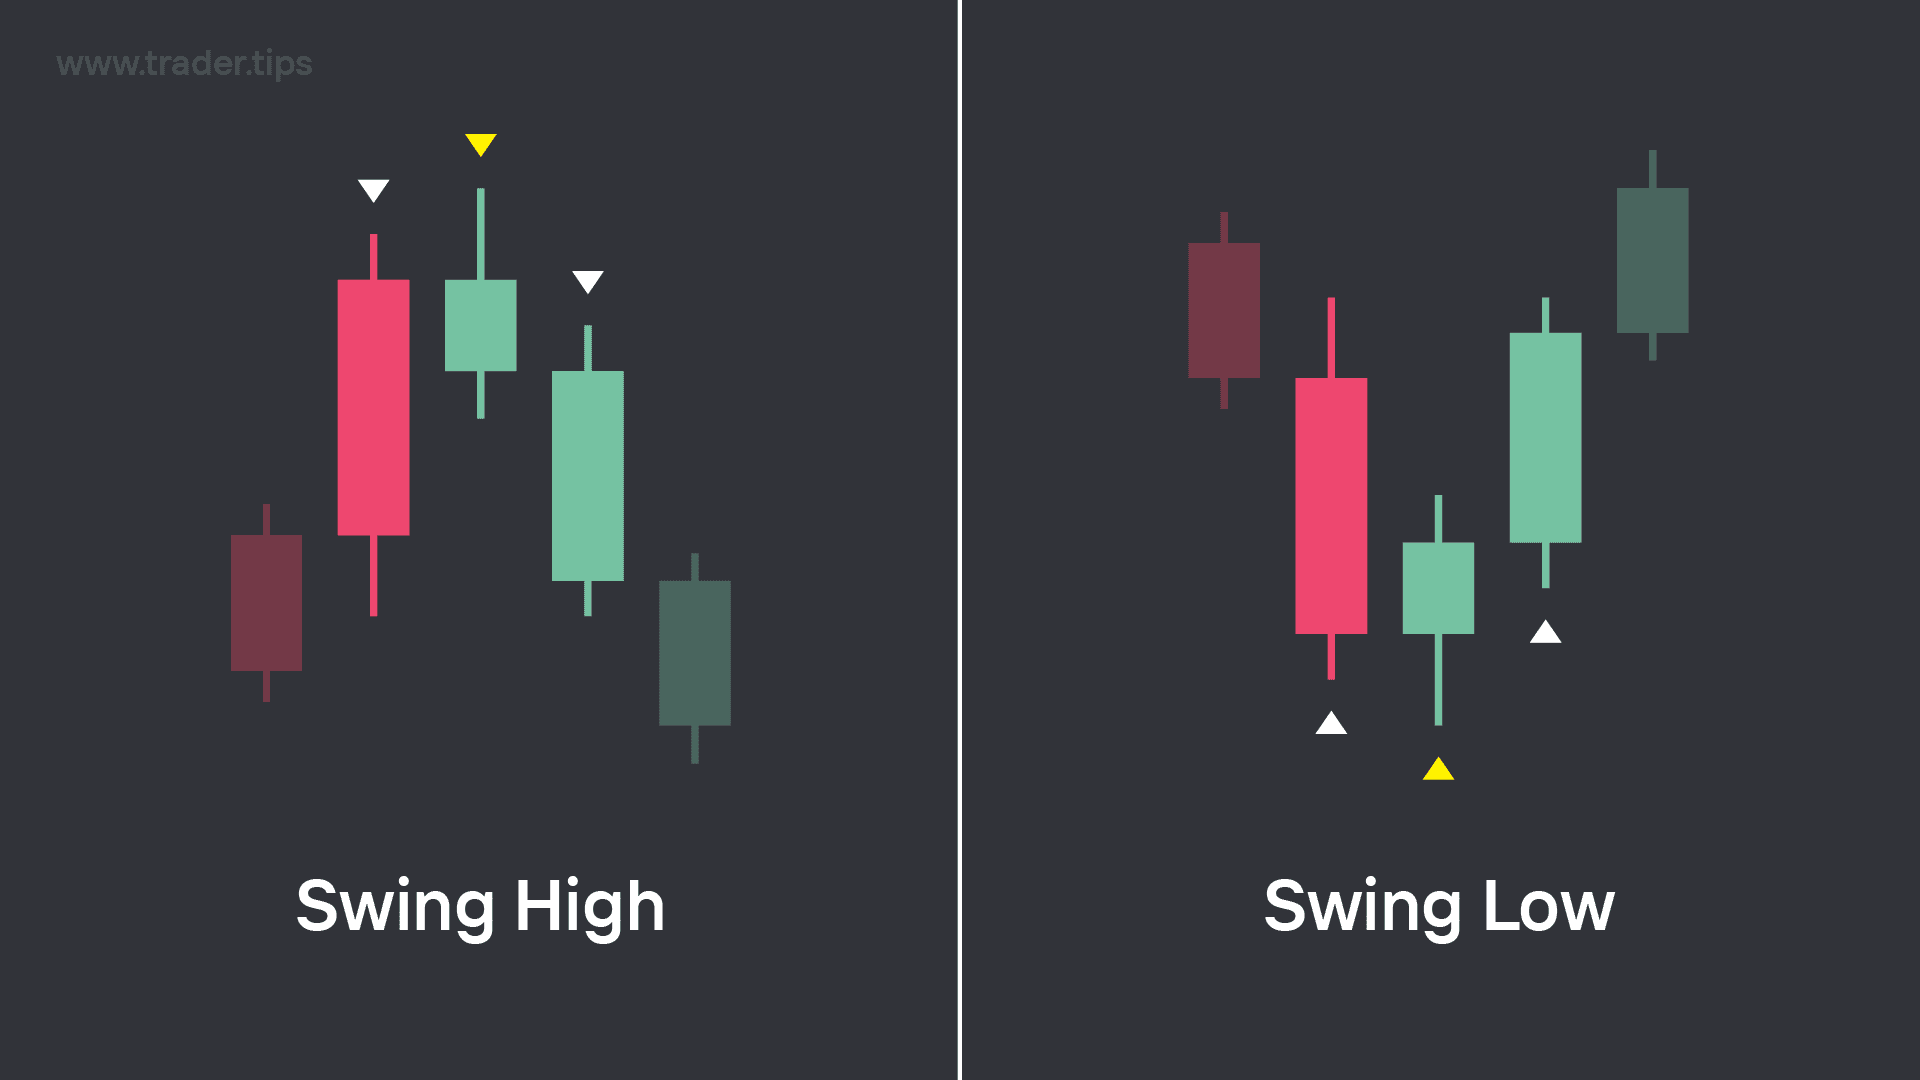
Example of a Swing High and a Swing Low.
We've covered Swing Highs and Swing Lows earlier in the course.
But just as a quick reminder, a swing high is formed when a candle's top wick is higher than the top wicks of both the candles to it's left and to it's right.
A swing low is formed when a candle's bottom wick is lower than the bottom wicks of both the candles to it's left and to it's right.
Swing highs and swing lows are used as market structure 'pivot points' by traders. Which is why they become very influential when it comes to where most traders tend to place their stop-loss and take-profit targets.
Swing High Liquidity
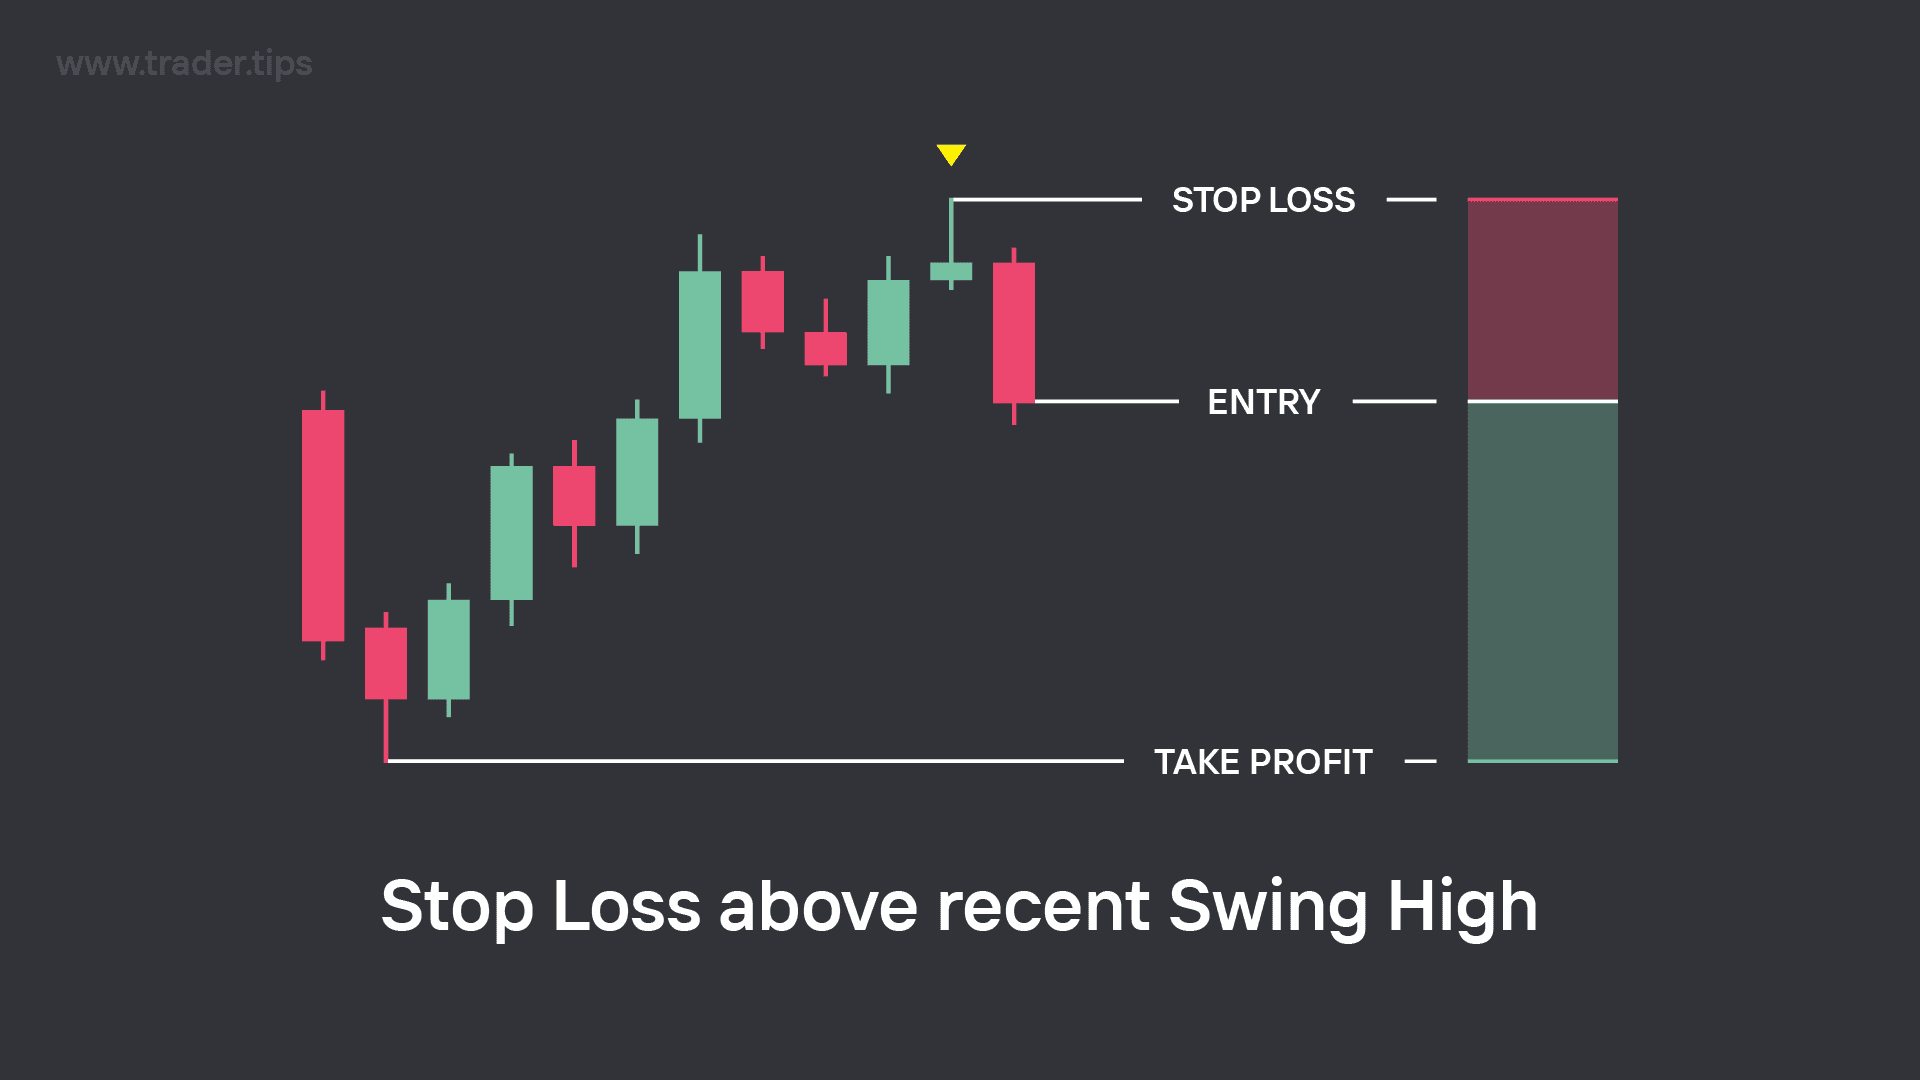
Example of a recent Swing High being used for Stop Loss placement during a Short Trade.
When most traders take a short trade, they will usually set their stop-loss level above a recent swing high, with the idea that if that swing high was to be hit, their trade setup would be invalidated.
Swing Low Liquidity
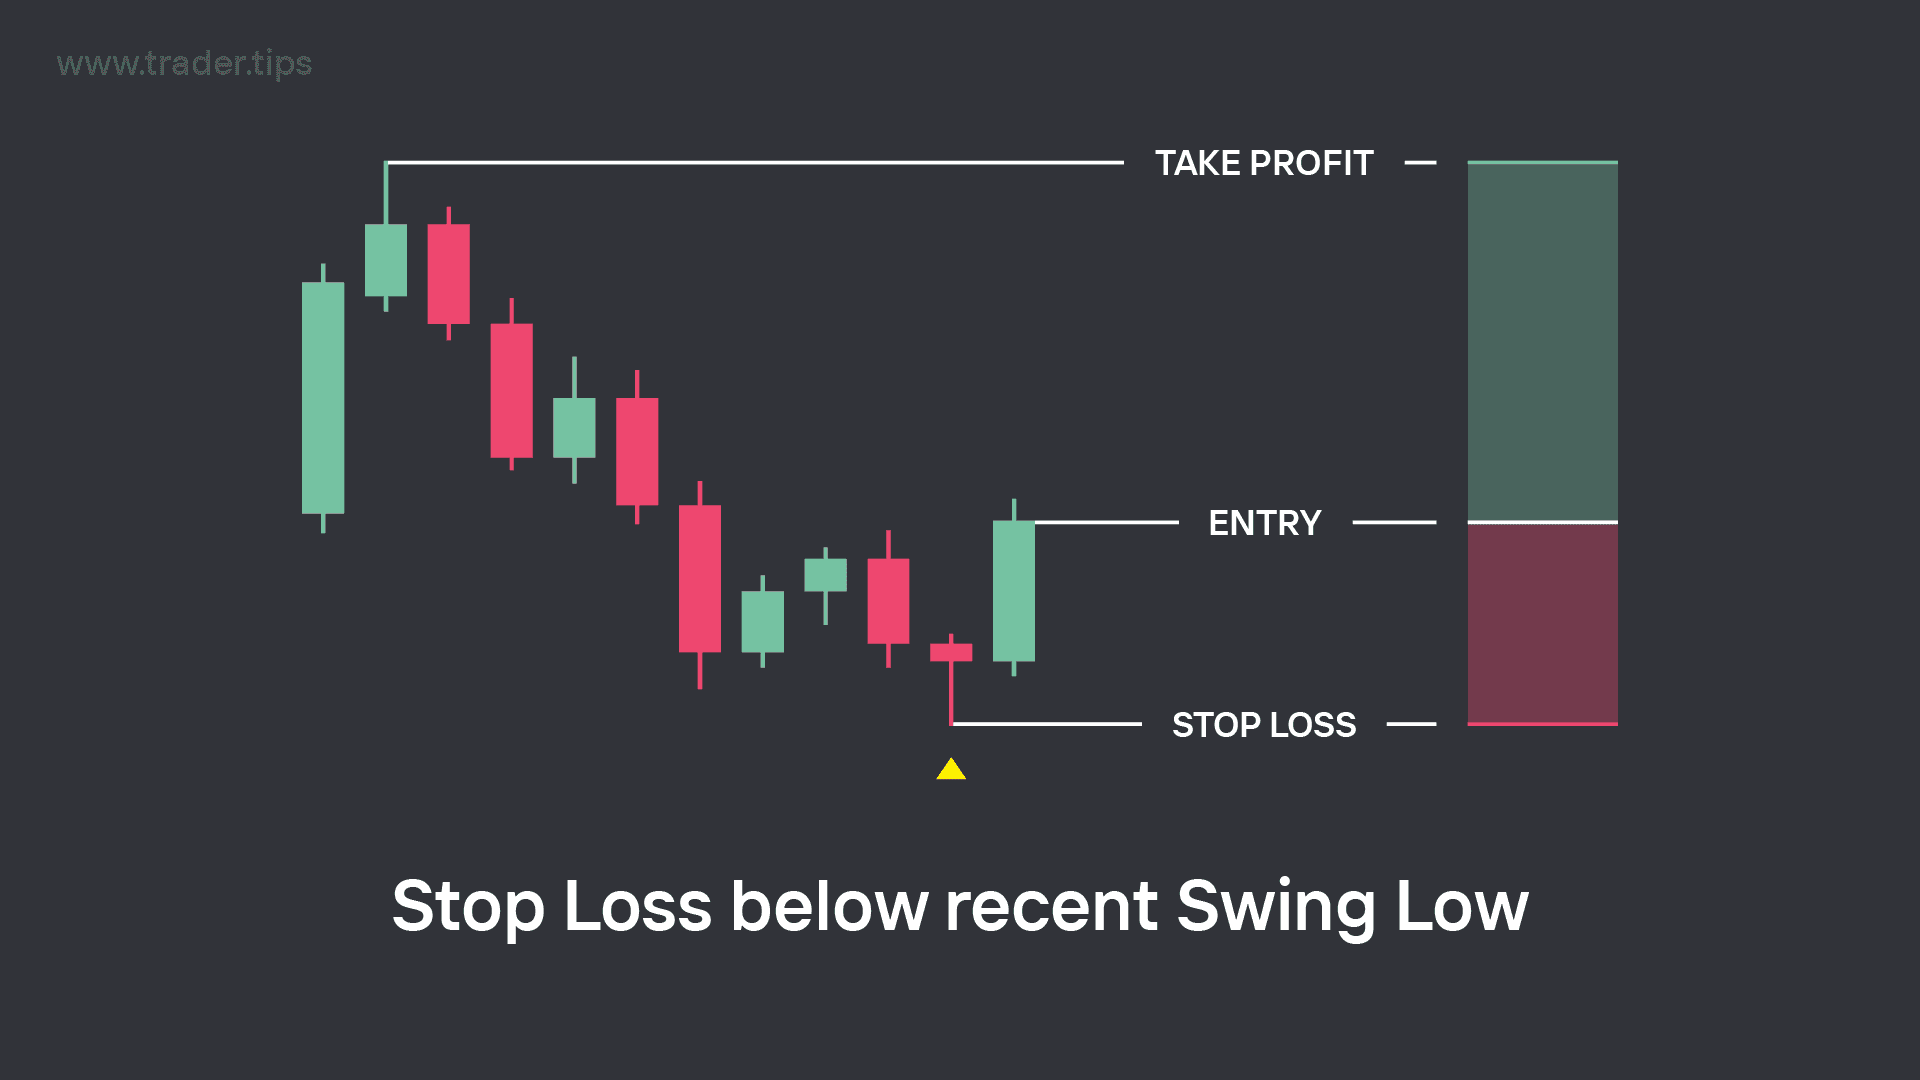
Example of a recent Swing Low being used for Stop Loss placement during a Long Trade.
When most traders take a long trade, they will usually set their stop-loss level below a recent swing low, with the idea that if that swing low was to be hit, their trade setup would be invalidated.
Liquidity Pools
Liquidity pools are created when a large volume of stop-loss orders are positioned in a cluster.
Which means if a large amount of people are using the same swing high or swing low for their stop-loss position, this will be an area that has a lot of liquidity (unfilled stop loss orders).
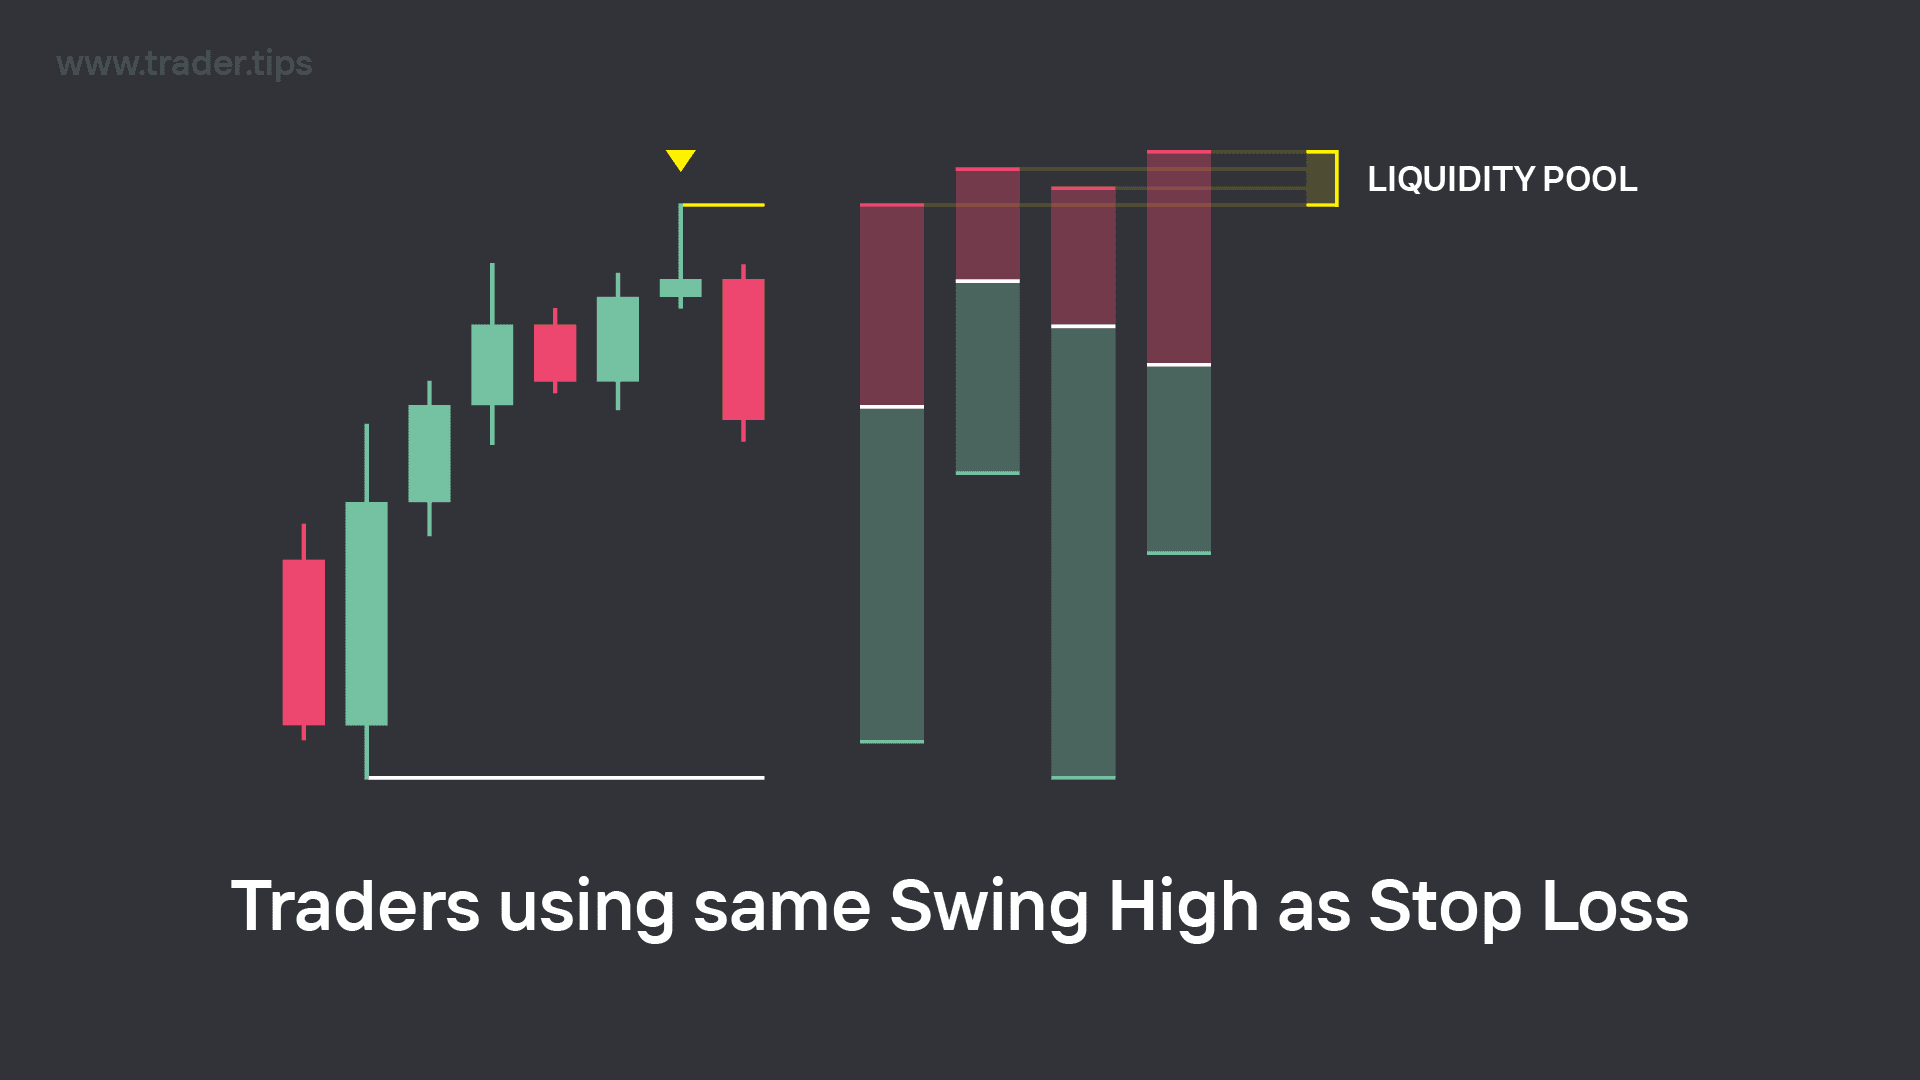
Liquidity Pool created above the recent Swing High from large volume of traders using it for their Stop Loss orders.
For example, in the image above, we have an example of a small piece of a chart's market structure which traders are shorting from.
The huge number of traders are all entering their short trades at different prices depending on what time they entered. Their Take Profit levels and Stop Loss levels are also all placed at different prices.
But the thing that all of these trades have in common is that the Stop Loss placements are all somewhere just above recent Swing High. Which means they are clearly using this Swing High as the invalidation level for their trades.
With the clustering of these Stop Loss orders all placed within a close proximity, it makes it a great target for institutions who are wanting to short the market, because they need a lot of buy orders to match their large sell orders.
If there aren't enough buy orders, the Institutions' large sell orders cannot be fully filled.
This is why targeting Liquidity Pools (clusters of unfilled Stop Loss orders) is the most convenient and efficient way for Institutions to enter trades.
Why are Stop Loss orders targeted?
If an institute wants to enter a short trade, they need people to 'match' their sell orders by placing buy orders at the same price.
A sell order can only be filled if there is someone on the other side that is buying the asset at the same price of the sell order.
There will be breakout traders placing buy orders above Swing Highs which can also be absorbed by the Institutes' large sell orders, but most of the Liquidity is made up by Stop Loss orders.
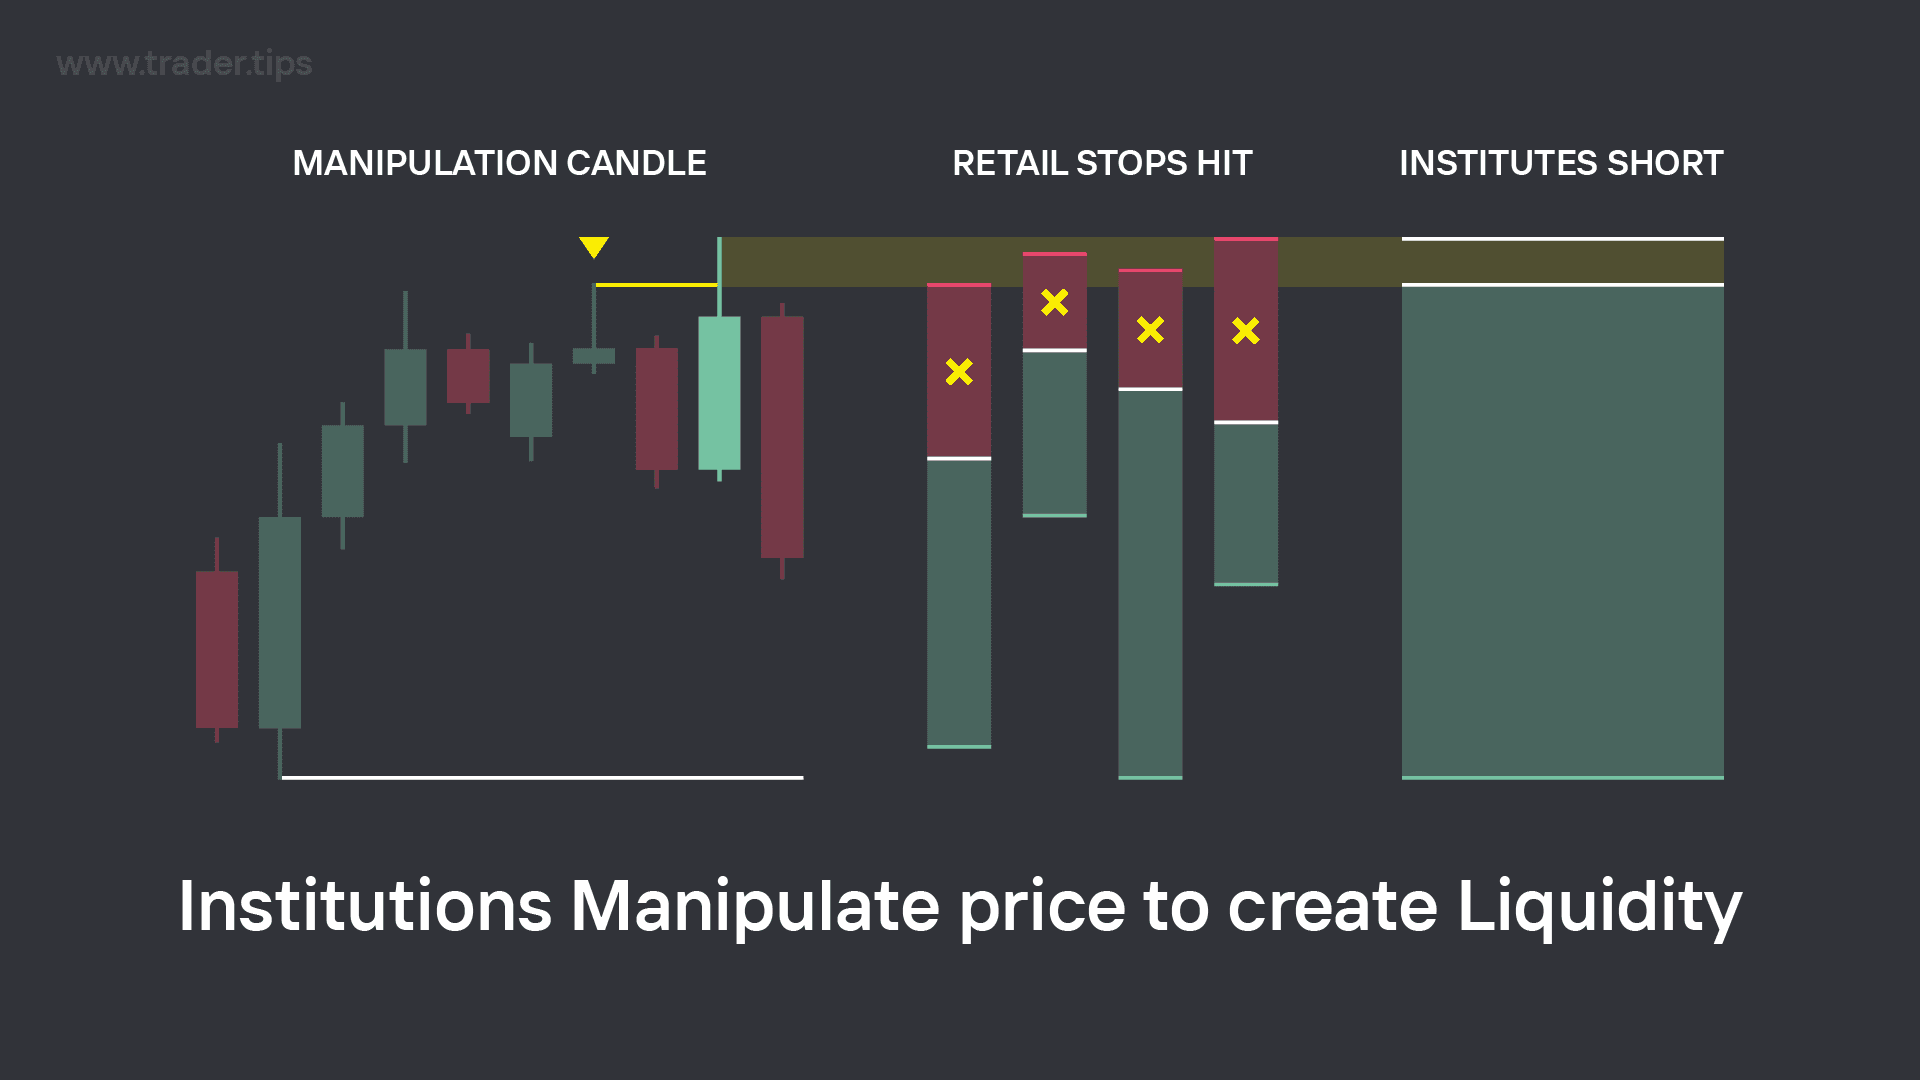
Institutions Manipulate price to create Liquidity Pools so they have enough matching volume for their large orders.
When a trader enters a short trade, this is a sell order. But when the trader exits the short trade, they would be executing a buy order.
For example, if you short the Nasdaq for 2 micros, when you exit that trade, you will essentially be buying back 2 micros to put your balance your trade back to a neutral 0 micros.
These buy orders will be triggered when price hits the Take Profit level of a trade, or when price hits the Stop Loss level of a trade.
Institutions will create 'Manipulation Moves' to target these clusters of Stop Loss orders, not just because they are the 'matching' orders they need to enter their trades, but the Stop Loss Liquidity will also be at a much more lucrative price when it comes to potential profit.
We want to short the market at the highest prices and long the market at the lowest prices. Institutions are no different.
What happens after a Liquidity Pool is 'raided'?
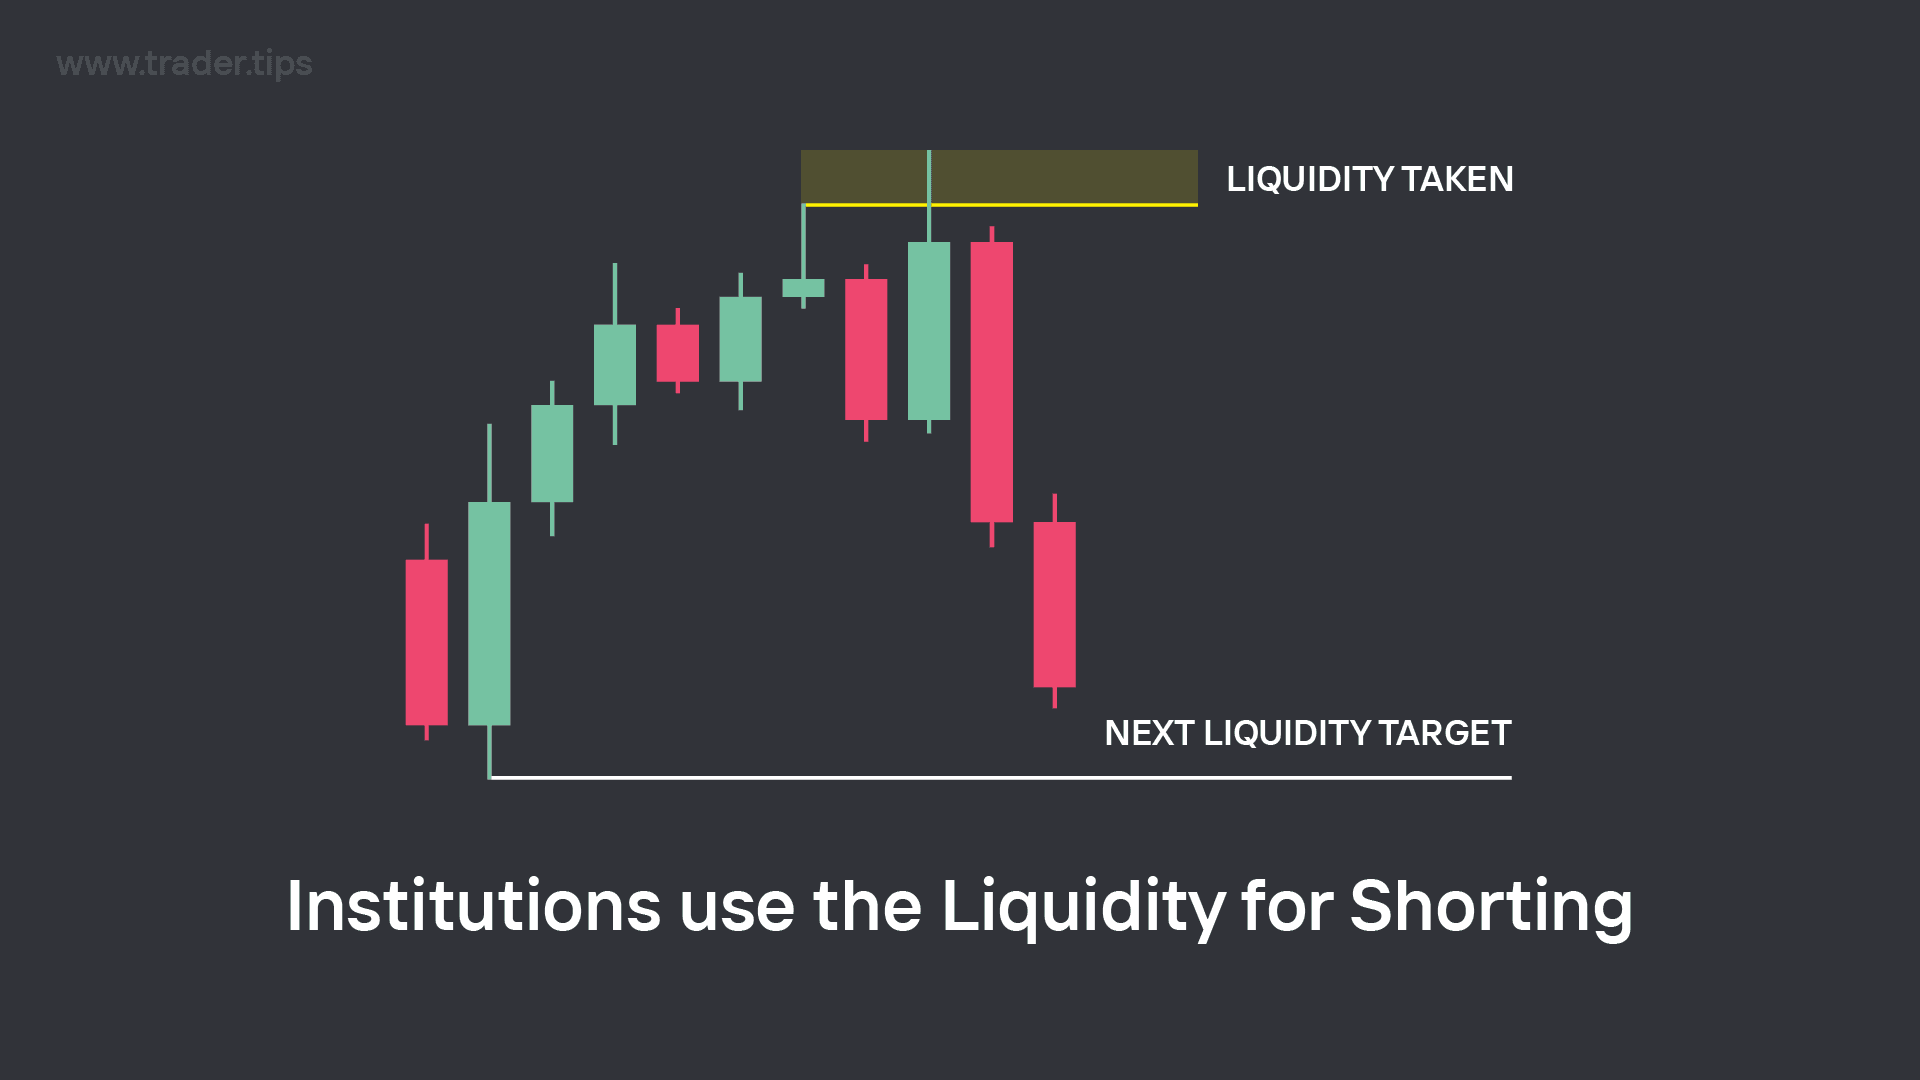
Institutions use the Liquidity (large volume of Stop Orders) above the Swing High to enter their large Short trades.
Once a Liquidity Pool has been raided and the Institutions have managed to fill their large trade orders, they'll then be wanting to make a profit on those trades.
This is where we will typically see a strong reversal move.
When a Swing High Liquidity (Buy Side Liquidity) is raided, the next expected target will be a Swing Low Liquidity (Sell Side Liquidity).
When a Swing Low Liquidity (Sell Side Liquidity) is raided, the next expected target will be a Swing High Liquidity (Buy Side Liquidity).
Buy side and Sell side Liquidity
When the market is in a range, it is moving inside the area between a swing high and a swing low.
This means that a range will contain both Swing High Liquidity (Buy Side Liquidity) and Swing Low Liquidity (Sell Side Liquidity).

Example of a Range spanning from a Swing Low to a Swing High.
There will be both buyers and sellers taking trades within a range.
This is the nature of how the markets work, it is a battle between buyers and sellers.
If there are more buyers, the price will go up. If there are more sellers, the price will go down.
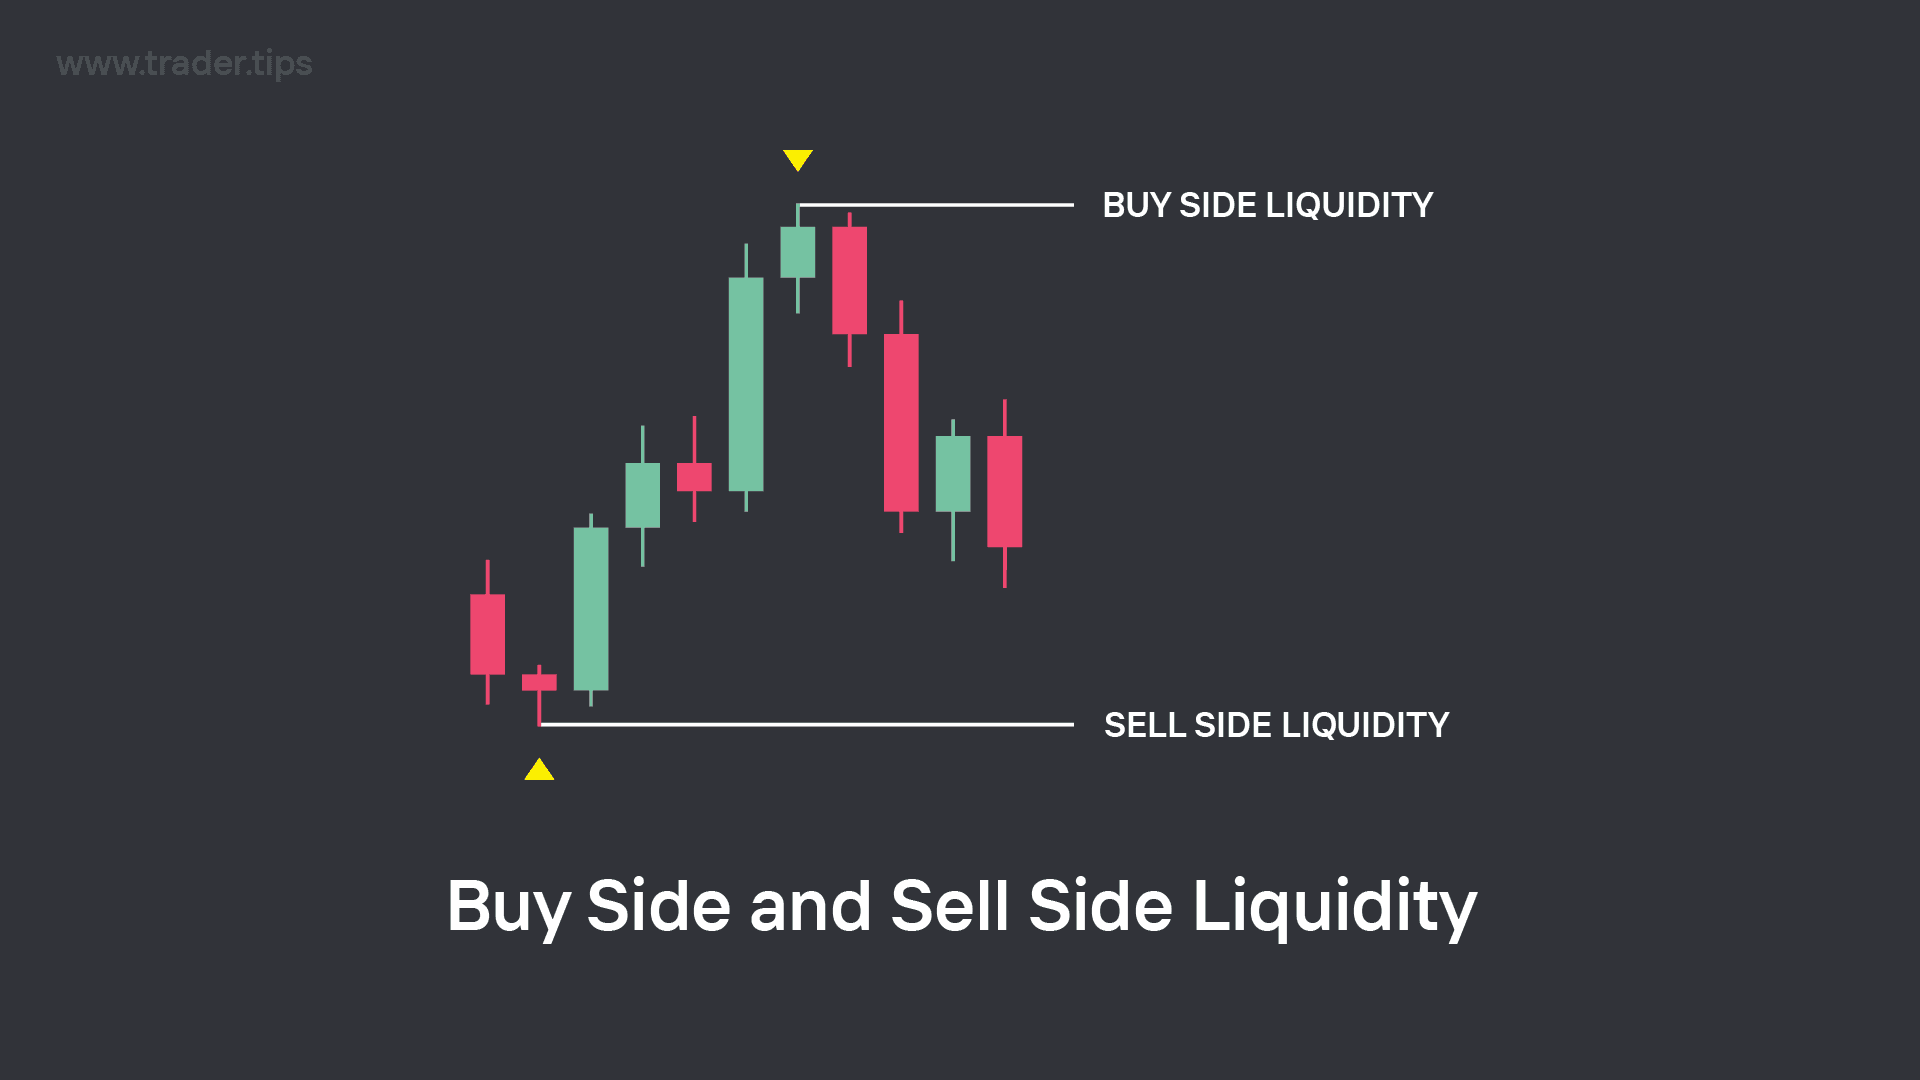
Example of Buy Side Liquidity above the Swing High and Sell Side Liquidity below the Swing Low.
With both buyers and sellers taking trades within a range, there will be liquidity both above and below the range:
Buy Side Liquidity above the Swing High from sellers' stop loss orders.
Sell Side Liquidity below the Swing Low from buyers' stop loss orders.
Buy Side Liquidity
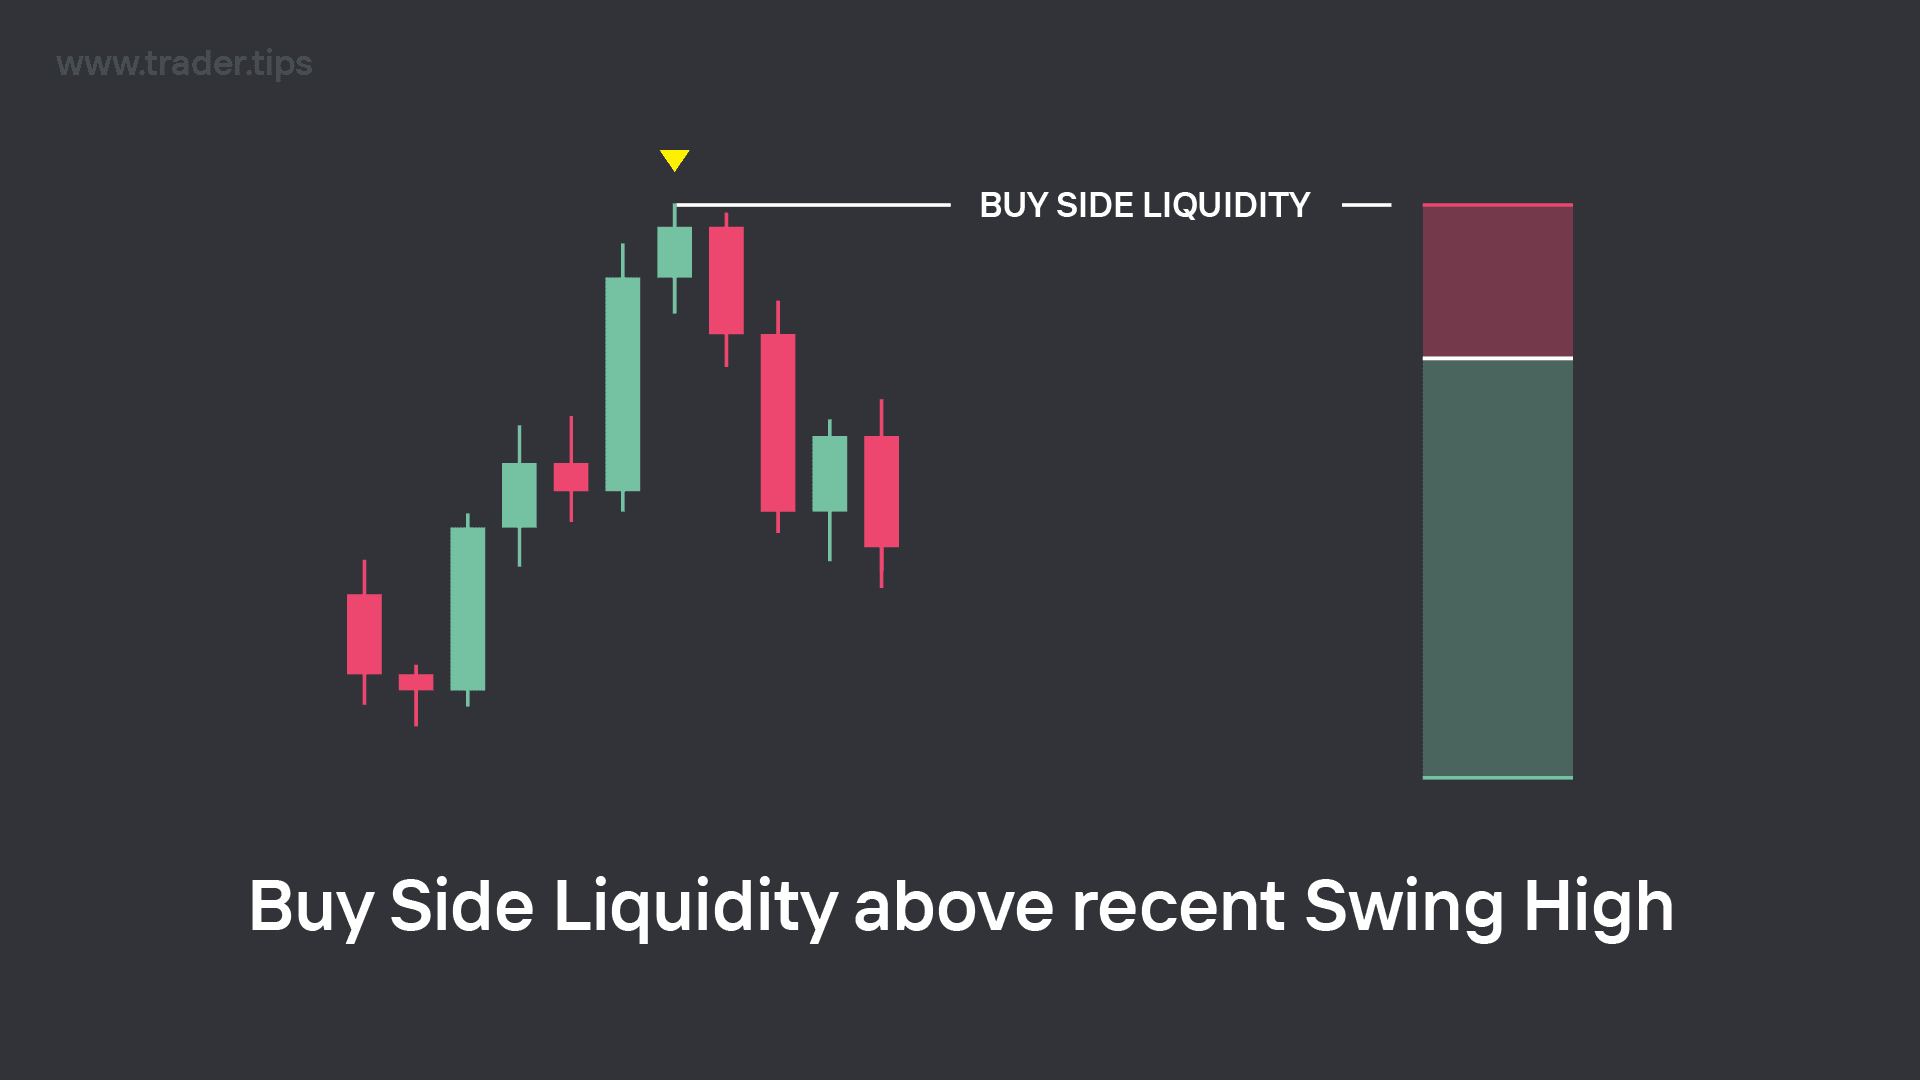
Buy Side Liquidity is created by clusters of buyers placing their Stop Loss Orders above Swing Highs.
From the sellers' perspective, they don't want to see the Swing High of the range get broken, because that would signal bullish strength. So above the Swing High is where we would see a cluster of the buyers positioning their stop losses for their short trades.
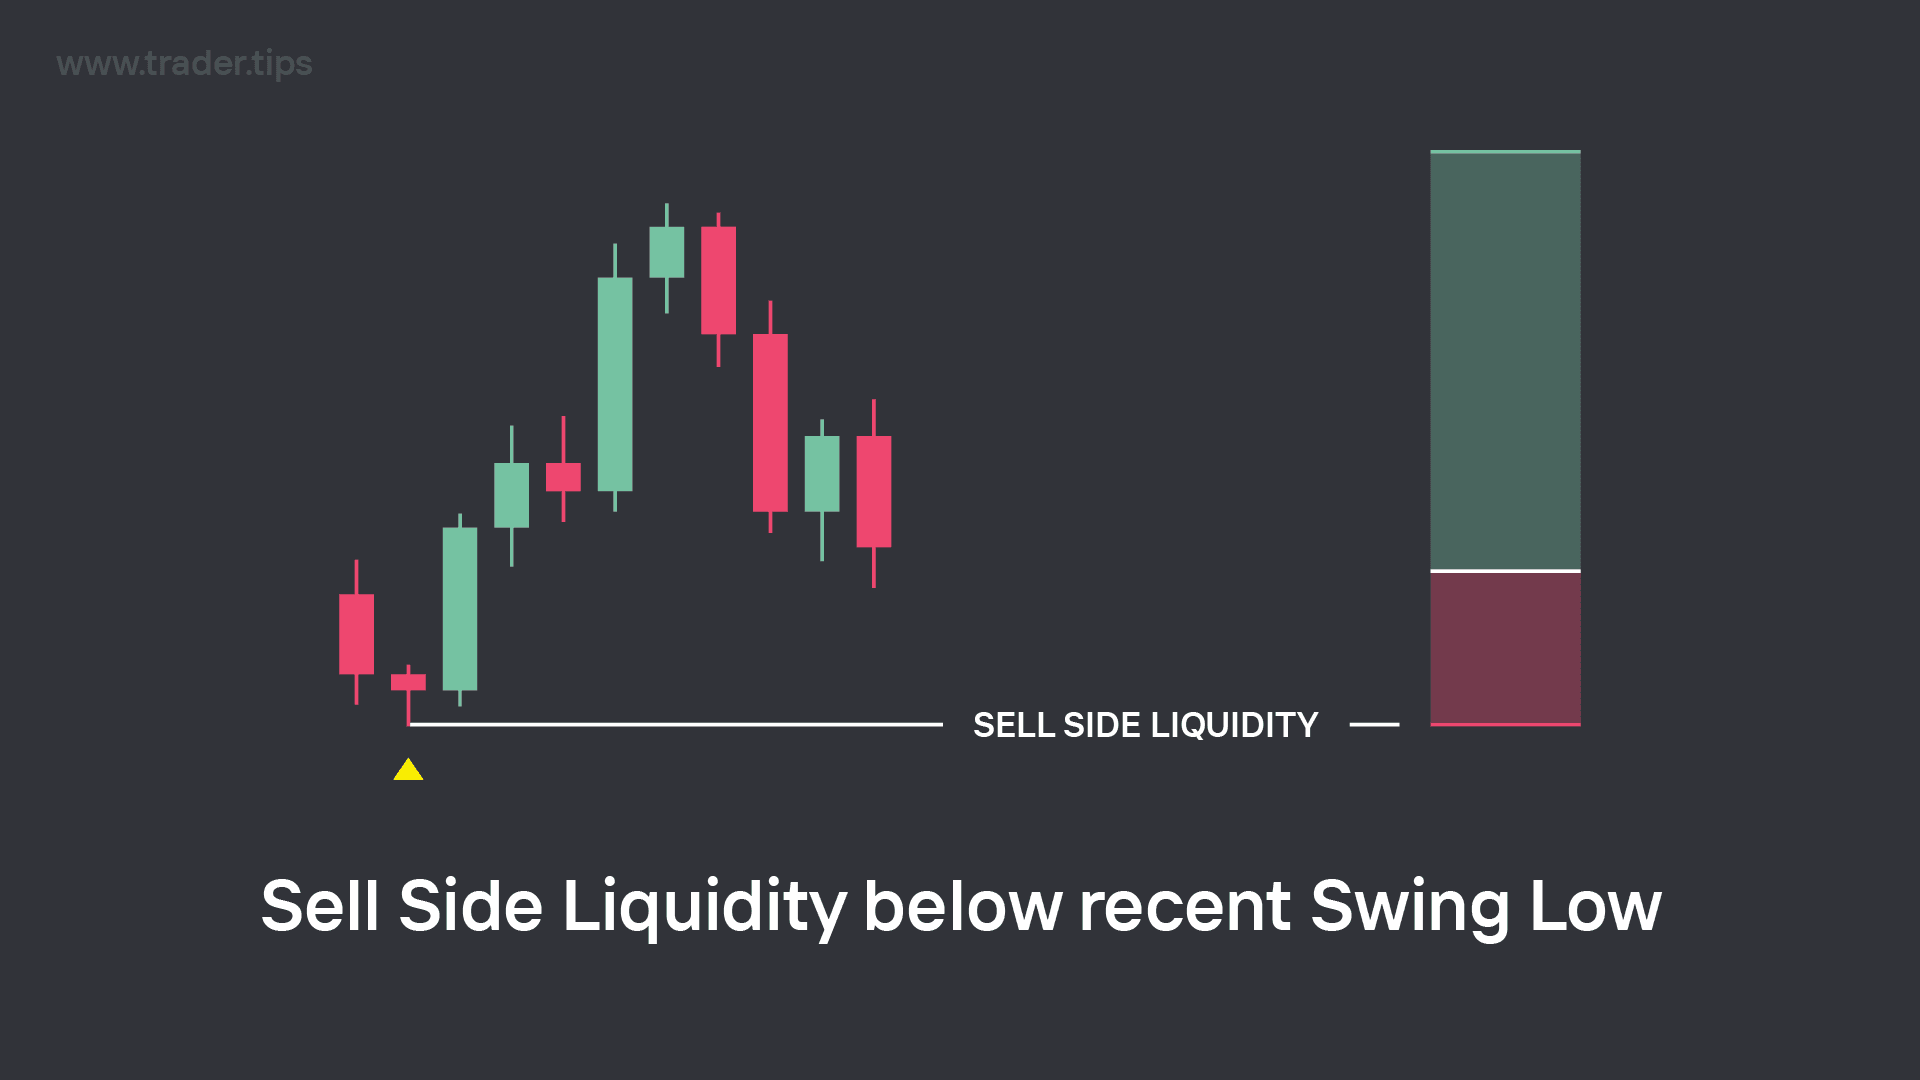
Sell Side Liquidity is created by clusters of sellers placing their Stop Loss Orders below Swing Lows.
From the buyers' perspective, they don't want to see the Swing Low of the range get broken, because that would signal bearish strength. So below the Swing Low is where we would see a cluster of the sellers positioning their stop losses for their long trades.
Most Important External Range Liquidity Levels
External Range Liquidity can be found above any Swing High or below Swing Low, but some swing points are a lot more significant than others when it comes to anticipating high volume reactive moves, which are:
Previous Month's High and Low
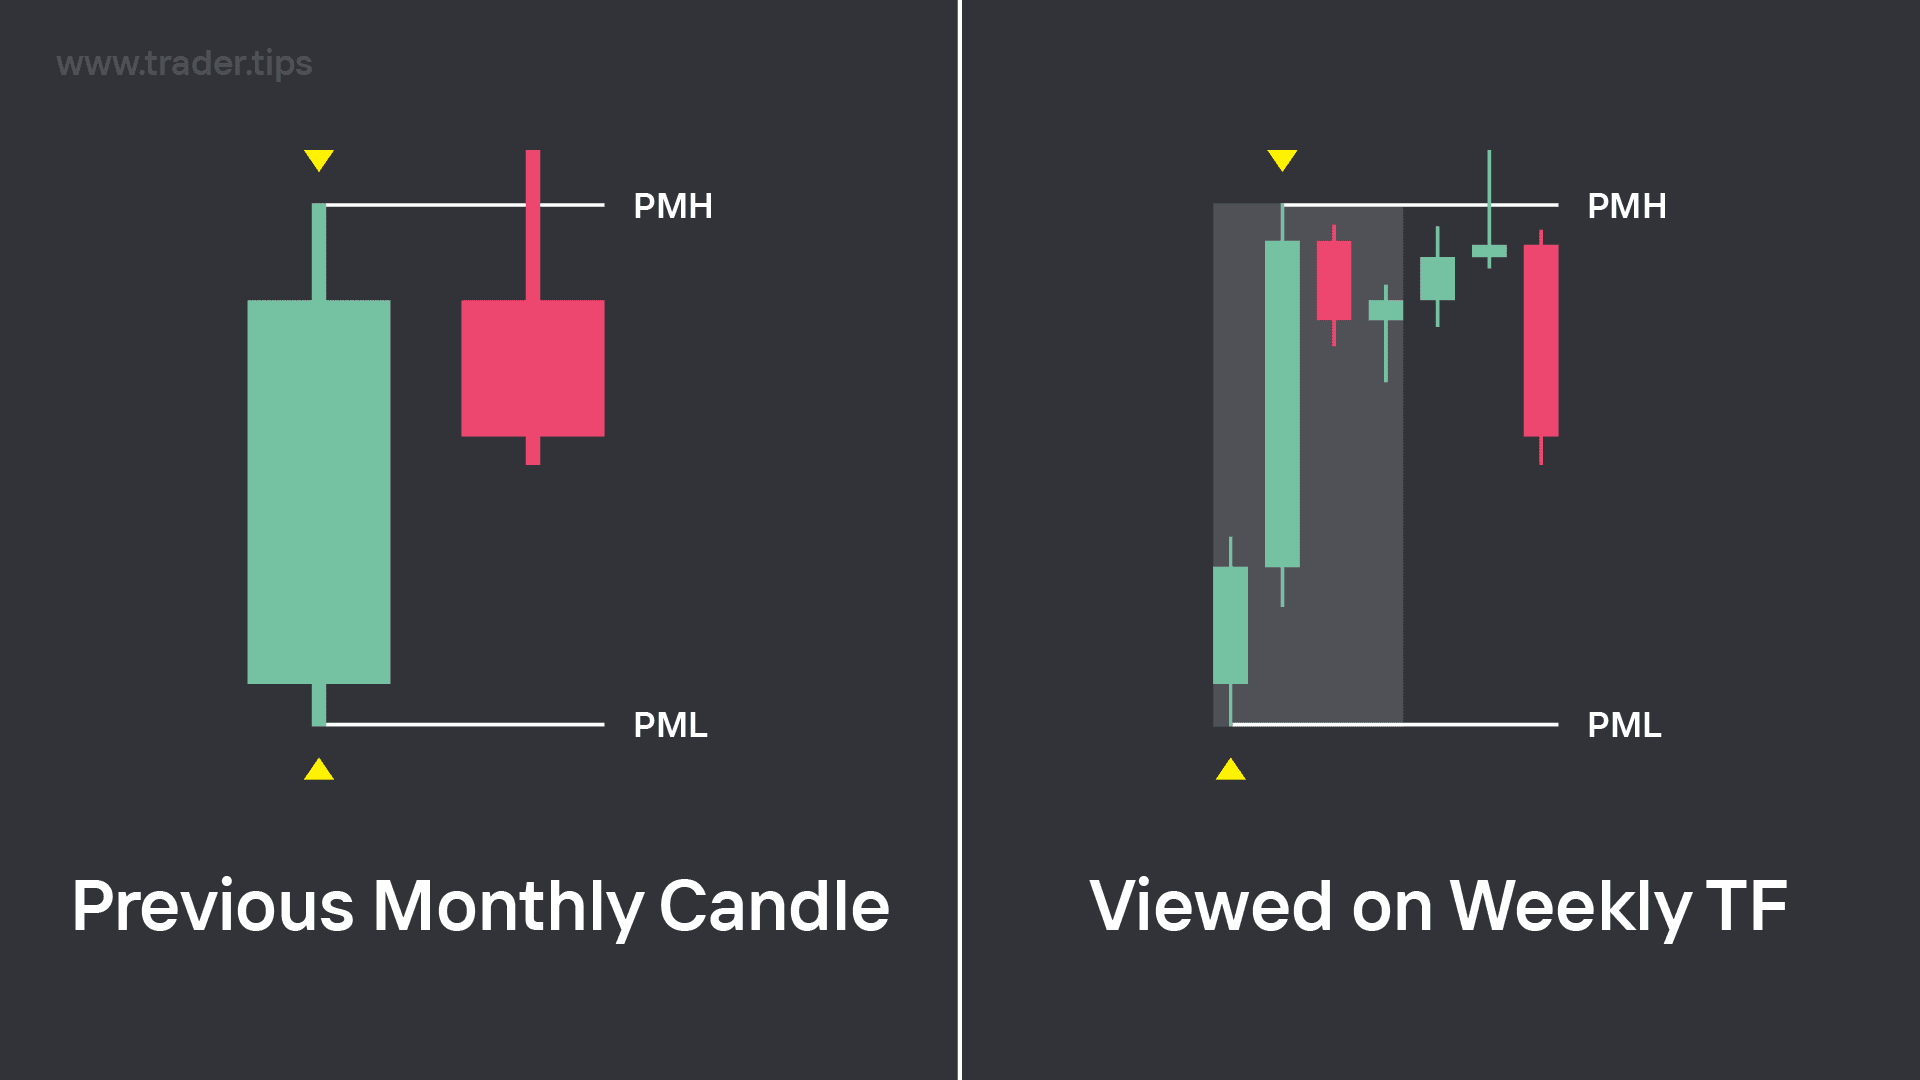
Previous Monthly High (PMH) and Previous Monthly Low (PML) viewed through the Weekly Timeframe.
When a monthly candle closes, this will create a new Previous Month High (PMH) and Previous Month Low (PML).
Both the high and low can be sensitive to high volume reactions. But with it being a monthly level, the event of the market hitting a PMH or PML is infrequent compared to other levels.
Previous Week's High and Low
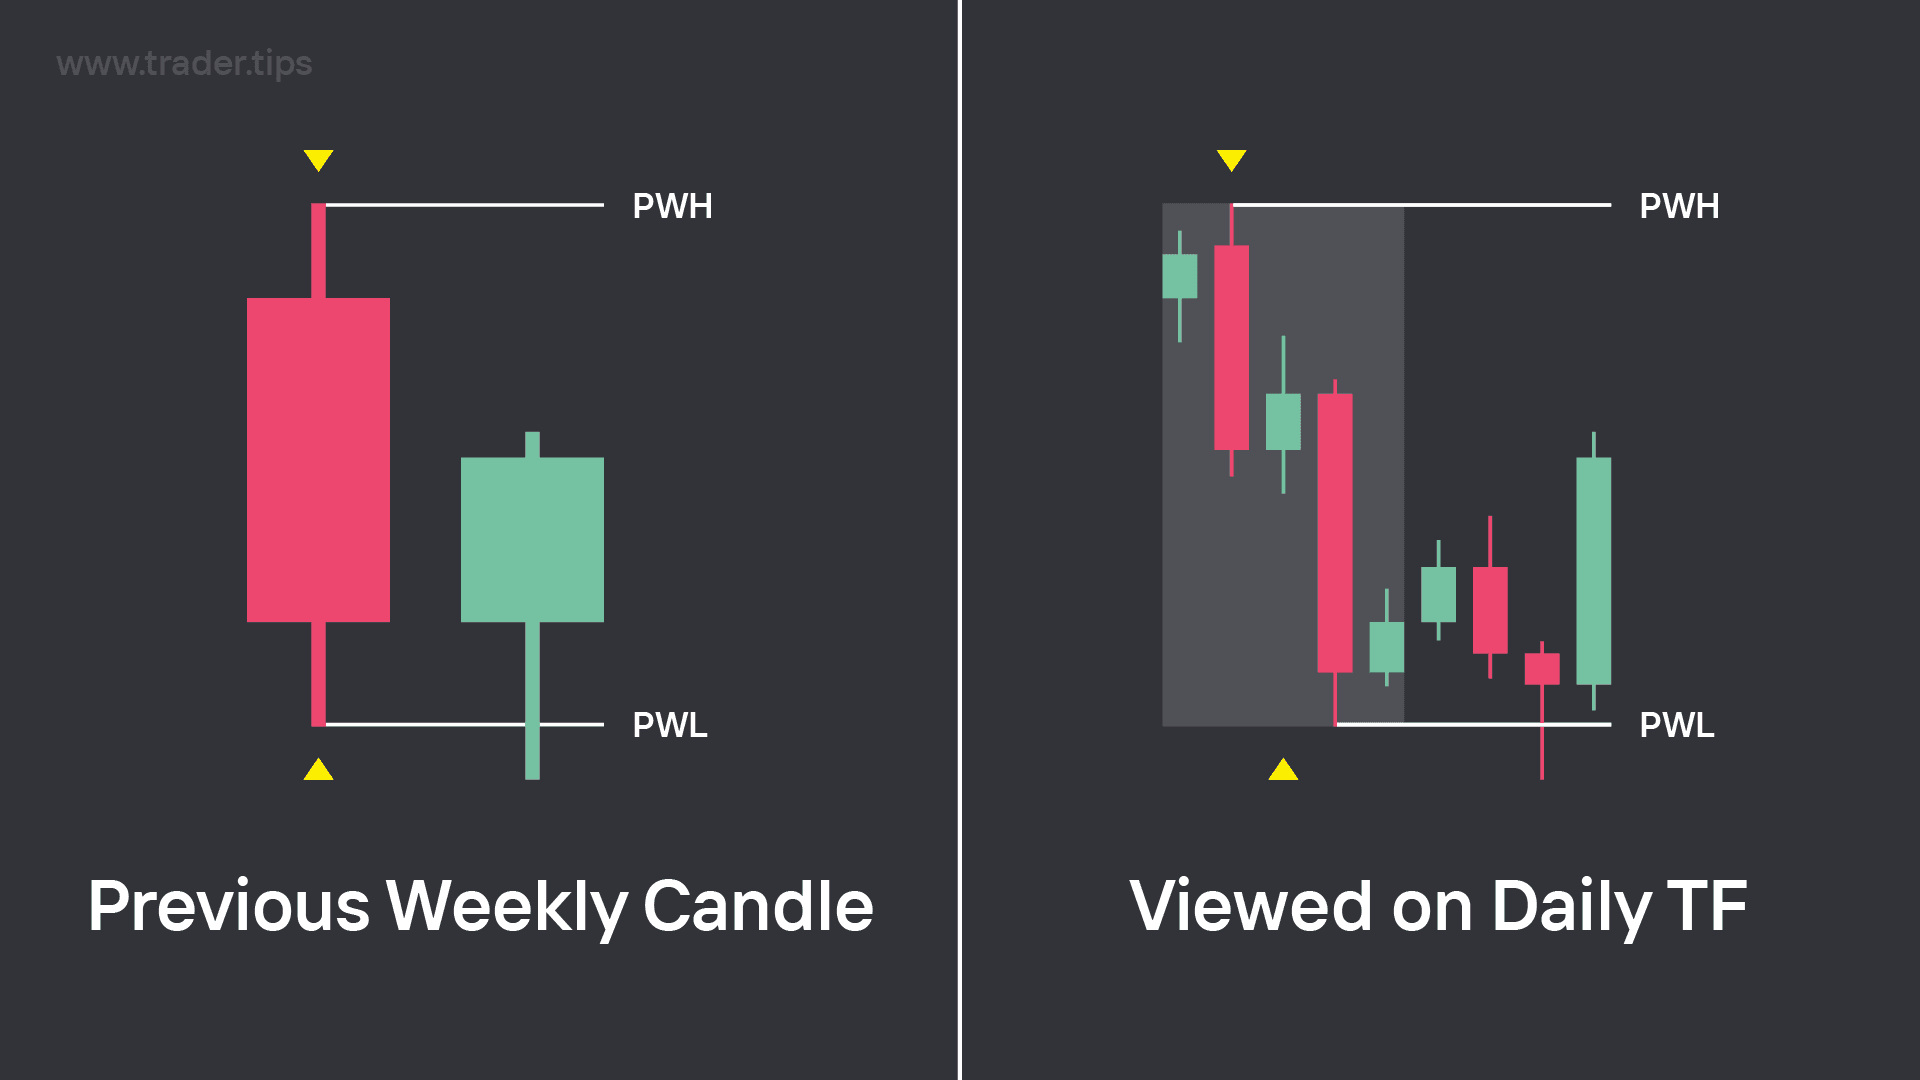
Previous Weekly High (PWH) and Previous Weekly Low (PWL) viewed through the Daily Timeframe.
When a weekly candle closes, this will create a new Previous Week High (PWH) and Previous Week Low (PWL).
Both the high and low can be sensitive to high volume reactions. With it being a weekly level, the event of the market hitting a PWH or PWL is usually happens at least once a week.
Previous Day's High and Low
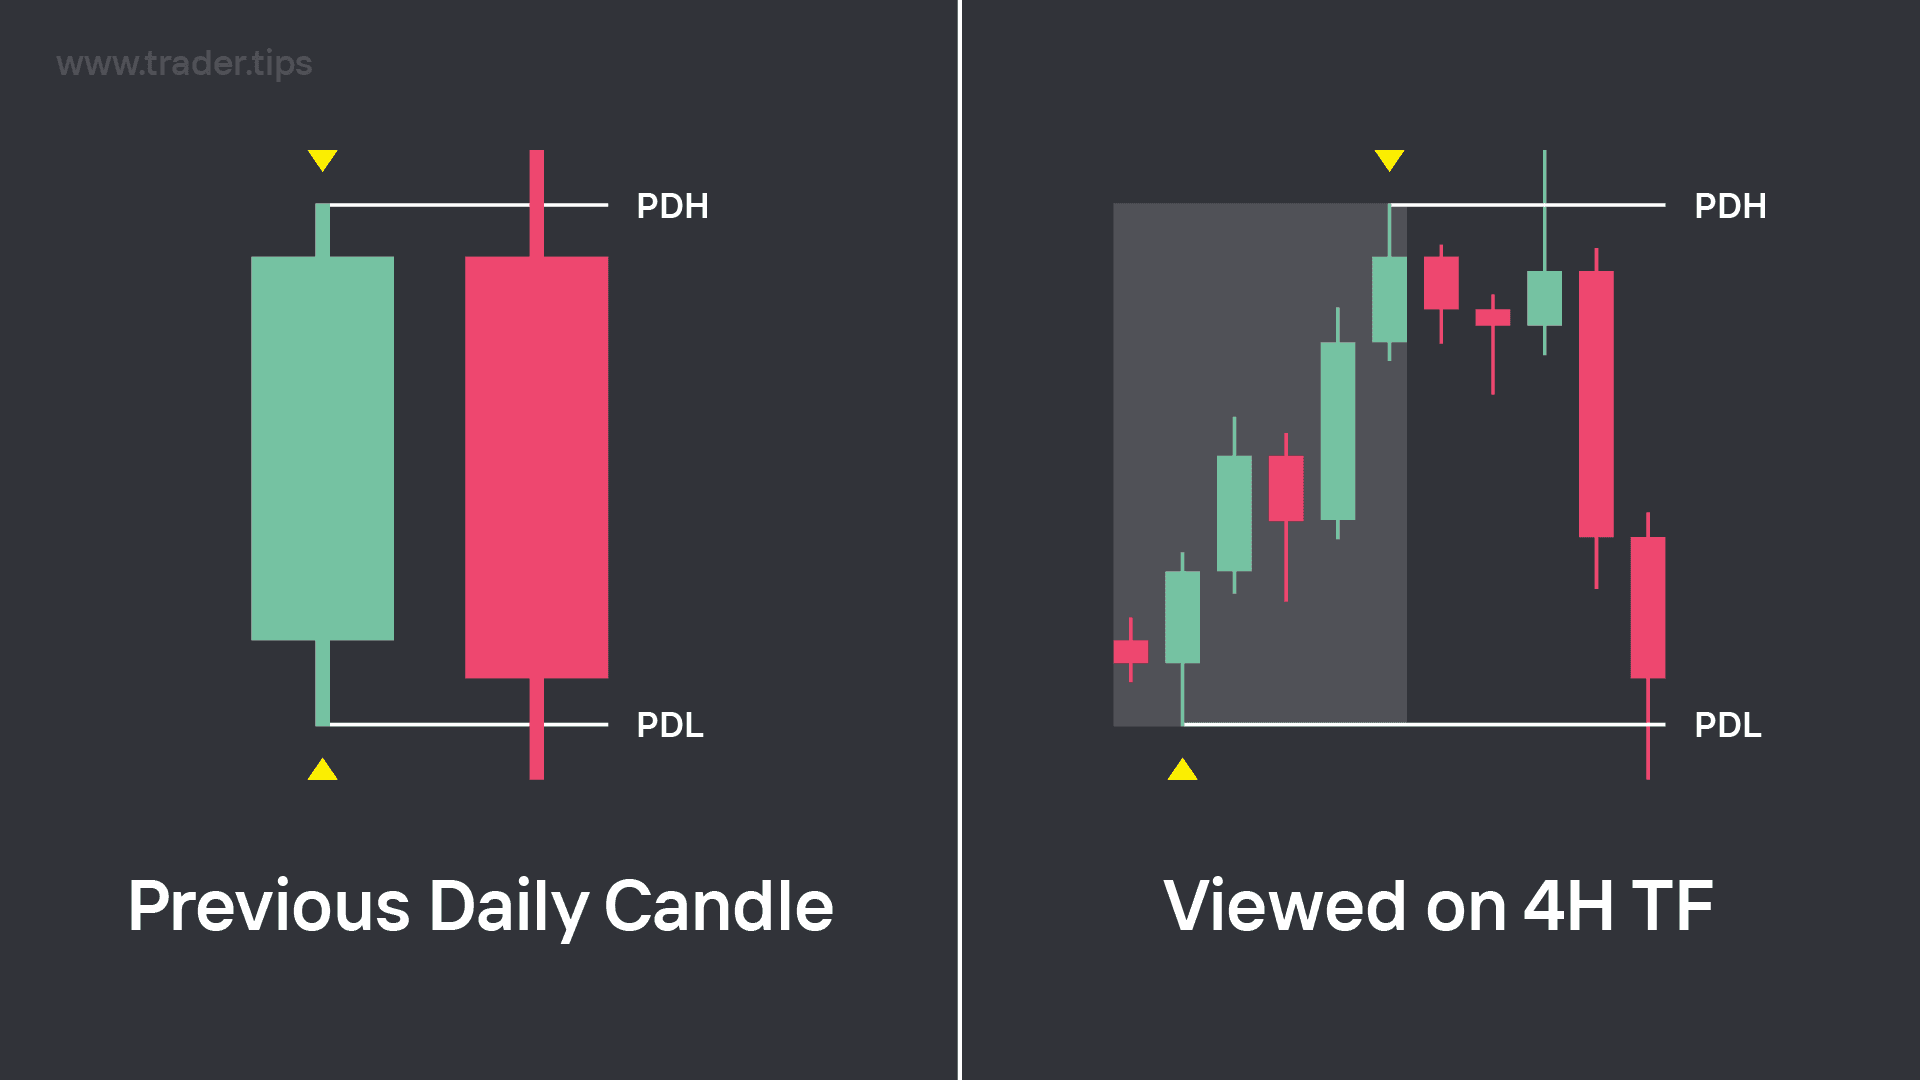
Previous Daily High (PDH) and Previous Daily Low (PDL) viewed through the 4 Hour Timeframe.
When a daily candle closes, this will create a new Previous Day High (PDH) and Previous Day Low (PDL).
Both the high and low can be sensitive to high volume reactions. With it being a daily level, we usually see the market hit at least one of the PDH/PDL levels every day, making PDHs and PDLs some of the best liquidity levels to look for setups from.
Session Highs and Lows
Every trading day, different market sessions open and close depending on the local time that they trade in.
These sessions consist of:
Sydney Session
Open between 5:00 PM – 2:00 AM EST.
Asia Session
Open between 7:00 PM – 4:00 AM EST
London Session
Open between 3:00 AM – 12:00 PM AM EST
New York Session
Open between 8:00 AM – 5:00 PM AM EST
Whilst there are 4 sessions, most traders typically ignore the Sydney session due to there typically being much lower volume in the market during these hours.
This means we only focus on the Asia, London and New York sessions where we can expect the larger moves to occur.

Session Highs and Lows.
Each session is open at different times in the day, forming their own isolated ranges.
The highs and lows of these session ranges are also considered liquidity levels which can cause high volume reactive moves.
With there being multiple session highs and lows forming each day, it's common for intraday reactions to form most days.
Liquidity Runs vs Liquidity Sweeps
When a External Range Liquidity level is hit, it can either create a 'Run on Liquidity', or a 'Sweep of Liquidity'.
Liquidity Run
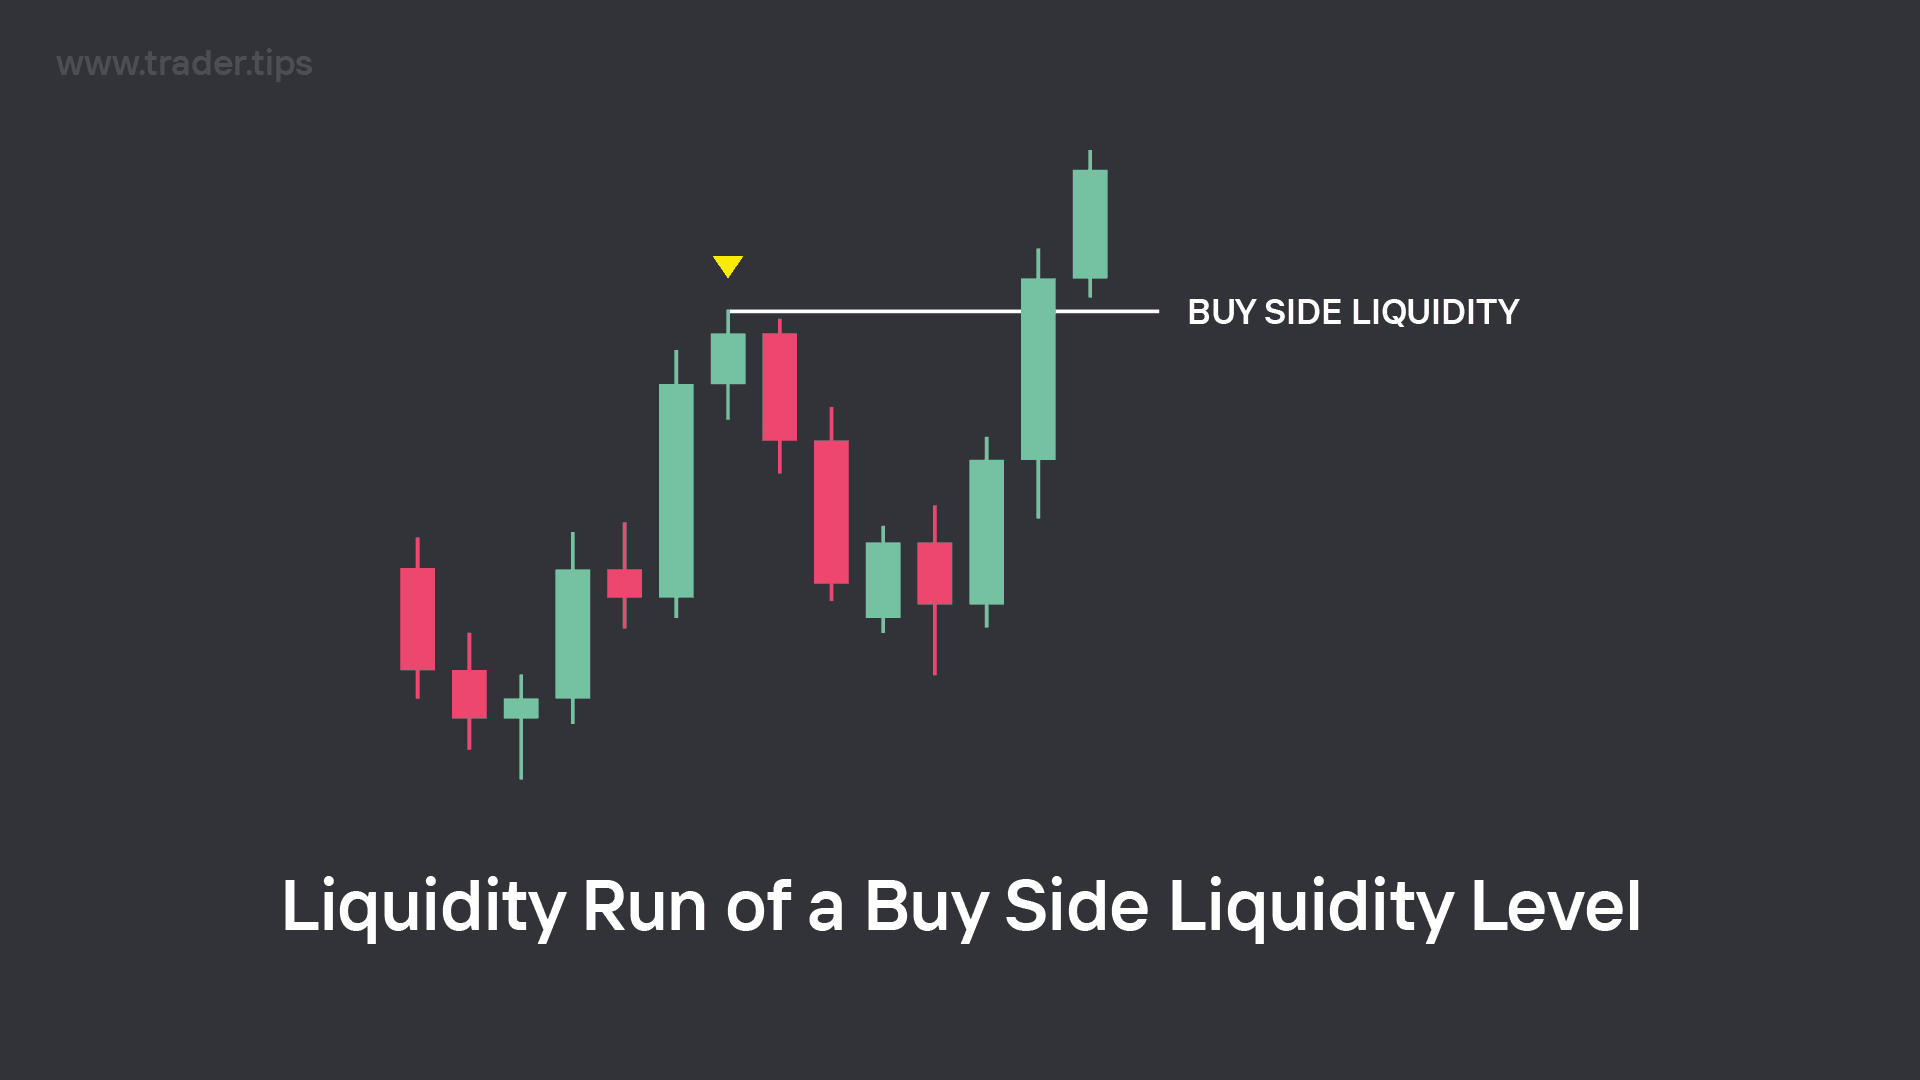
Example of a Liquidity Run of a Buy Side Liquidity Level.
A Liquidity Run is created when the market hits the liquidity level and then continues pushing further in that direction.
When a Liquidity Run occurs, we determine that the market is wanting to expand further in that direction to target a more external Draw on Liquidity target.
A run on a Buy Side Liquidity would see the market continue pushing further up, whereas a run on a Sell Side Liquidity would see the market continue pushing further down.
Liquidity Sweep
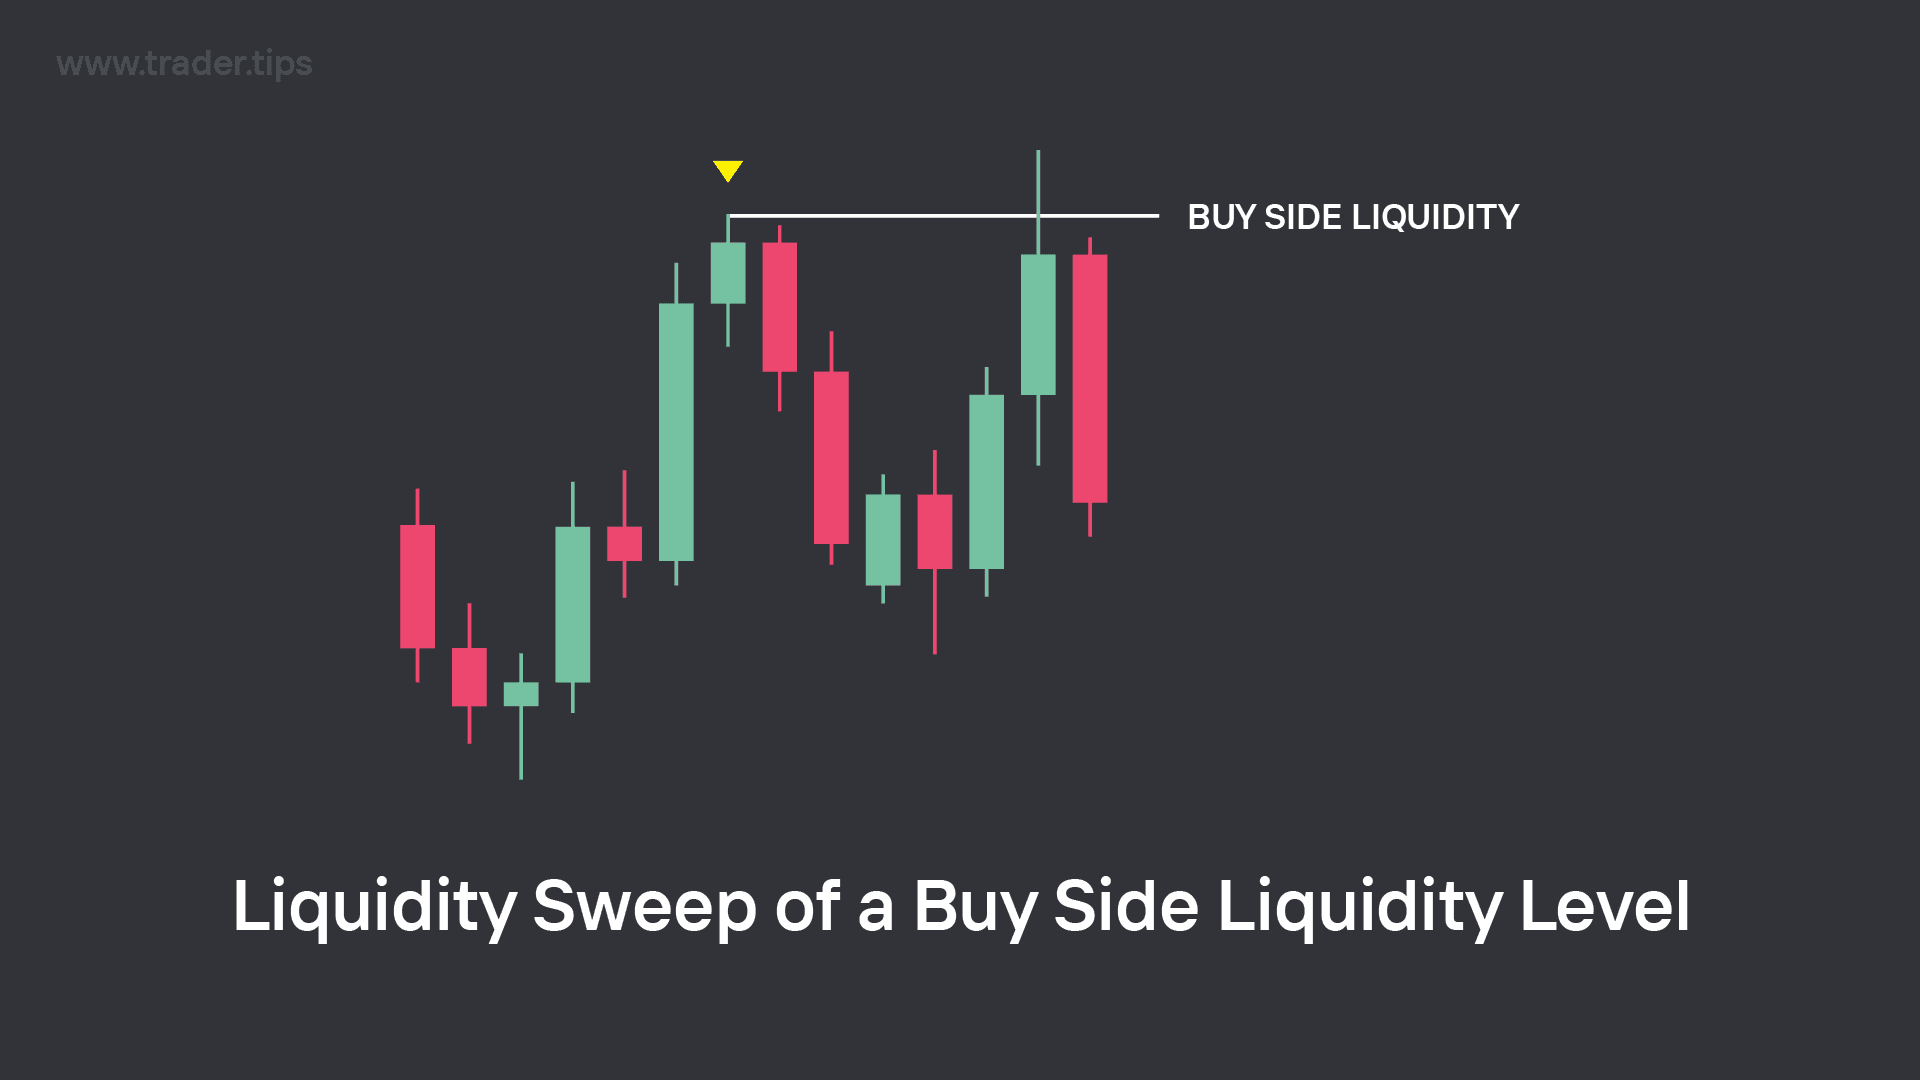
Example of a Liquidity Sweep of a Buy Side Liquidity Level.
A Liquidity Sweep is created when the market hits a Liquidity level, but then immediately reverses in direction.
When a Liquidity Sweep occurs, we determine that the market has absorbed the Liquidity above/below that Liquidity level, filling up the massive institution orders, so they can now reverse the market back the other way.
A sweep on a Buy Side Liquidity would see the market reverse downwards, whereas a sweep on a Sell Side Liquidity would see the market reverse upwards.
Mitigated External Range Liquidity Levels
It's important to note that when a liquidity level is hit, whether it runs or sweeps, we consider it 'mitigated', which means we consider the liquidity to be absorbed, so we wouldn't use that specific swing point as a target more than once.
Final Notes
We will look a lot deeper into Liquidity Runs and Liquidity Sweeps further into the course.
Liquidity is the most important concept when it comes to trading Smart Money Concepts, this chapter is just a brief inside into understand what liquidity levels are.
But we will expand further on how we find our Draw on Liquidity targets further into the course, there are other concepts that first need to be learnt.