Trading Reversals and Expansion

Back

Back

Back

Trading Reversals and Expansion

None

Trading Reversals and Expansion

Published by Trader Tips,

Published by Trader Tips,

Chapter 1

Reversal Phases and Expansion Phases

Bullish Reversal followed by Bullish Expansion.

The easiest way to form a Directional Bias (Bullish or Bearish) for whether we should be looking for long setups or short setups, is to determine whether we are currently in a Reversal Phase or an Expansion Phase.

Bullish Reversal (new Swing Low) followed by Bullish Expansion.

The 'Reversal Phase' is the creation of the new Swing Point.

Reversal Phases are only valid after hitting a Key Level. If a new Swing Point forms in the middle of a range without hitting a Key Level, whilst it still can still cause an unexpected Reversal, we should always remain cautious if a Key Level hasn't been mitigated.

The 'Expansion Phase' is the move away that follows the reversal, targeting the new Draw on Liquidity level.

Reversal Phases and Expansion Phases

Bullish Reversal followed by Bullish Expansion.

The easiest way to form a Directional Bias (Bullish or Bearish) for whether we should be looking for long setups or short setups, is to determine whether we are currently in a Reversal Phase or an Expansion Phase.

Bullish Reversal (new Swing Low) followed by Bullish Expansion.

The 'Reversal Phase' is the creation of the new Swing Point.

Reversal Phases are only valid after hitting a Key Level. If a new Swing Point forms in the middle of a range without hitting a Key Level, whilst it still can still cause an unexpected Reversal, we should always remain cautious if a Key Level hasn't been mitigated.

The 'Expansion Phase' is the move away that follows the reversal, targeting the new Draw on Liquidity level.

Chapter 2

Swing Point And Expansion Architecture

Swing High with Expansion and Swing Low with Expansion

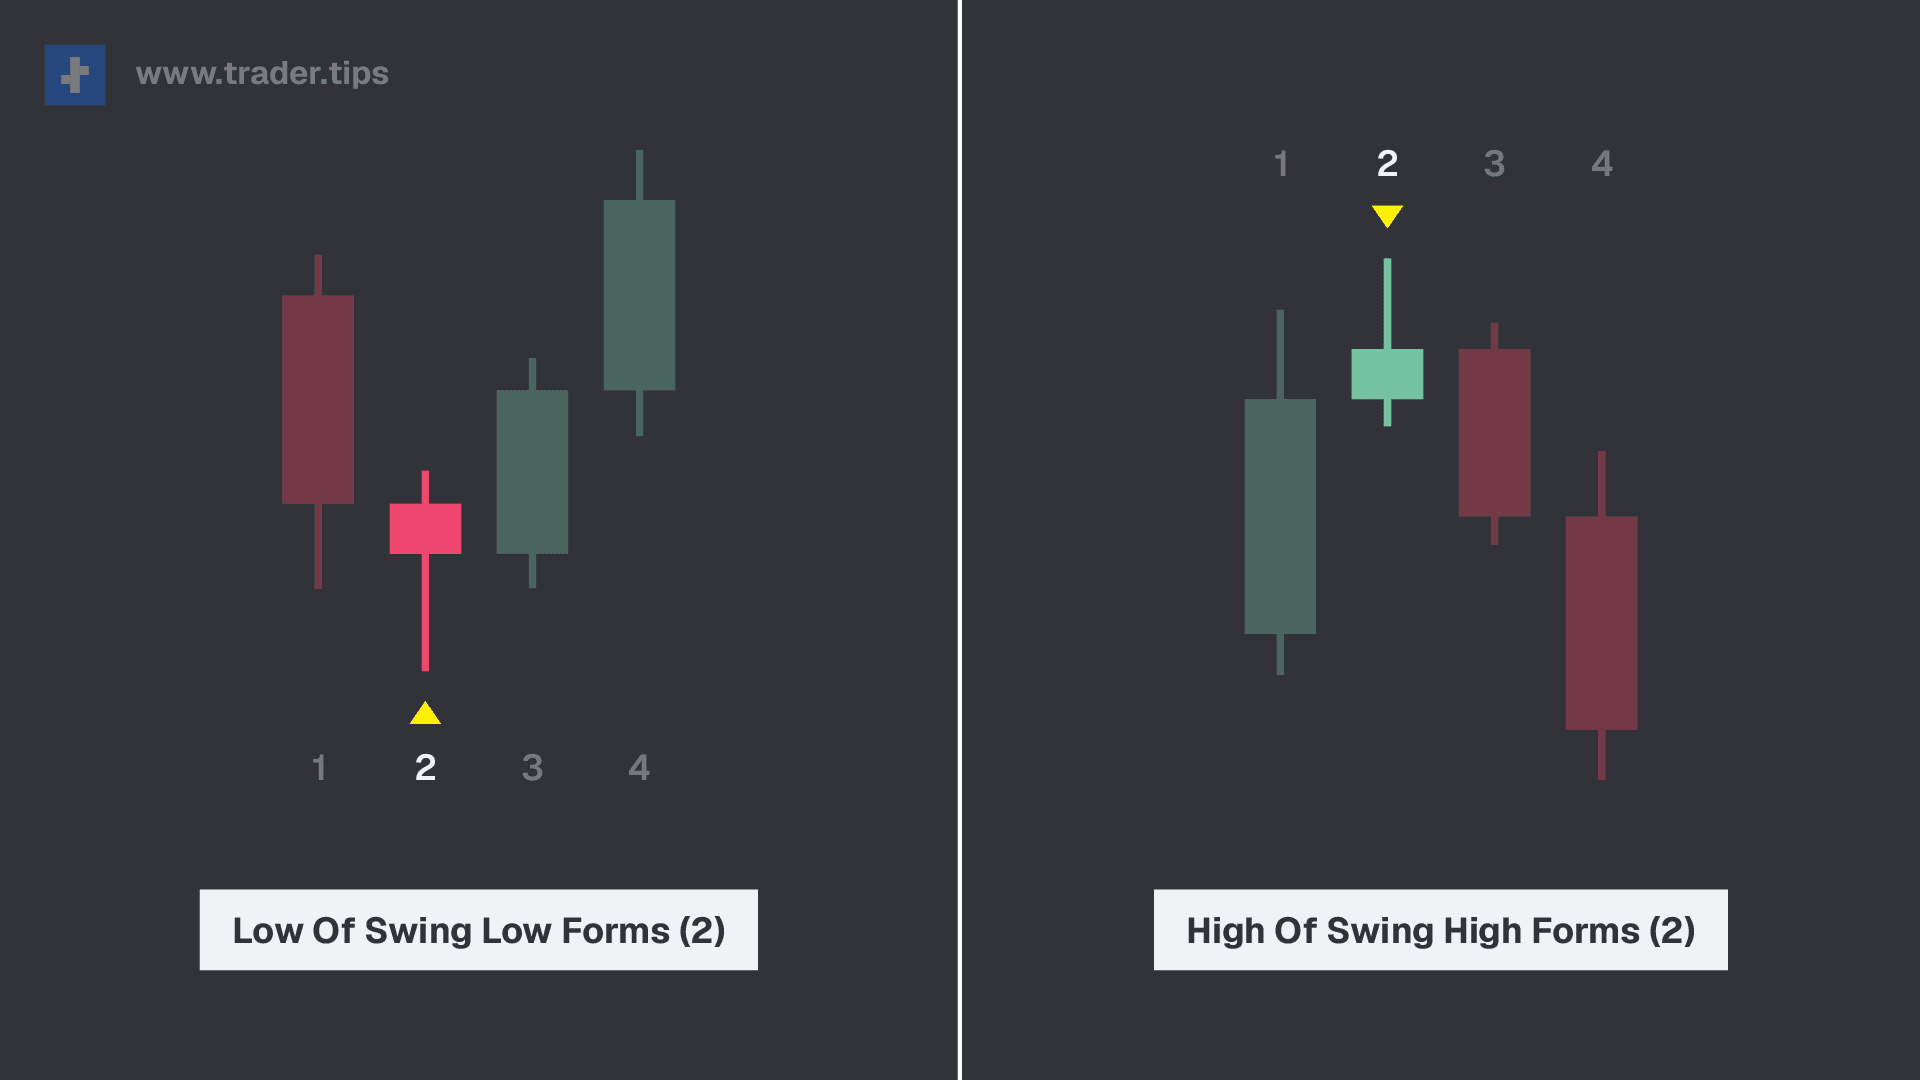
Swing High/Low creation (1-3) followed by Expansion away (4+).

A Swing Point (Swing High or Swing Low) is a 3 candle pattern where the high/low of the Swing Point is formed in the 2nd candle.

Candle 4 and the candles that follow it are what we consider the Expansion Phase.

Candle 1 - Start of a new Swing Point

Candle 1 of a Swing Point.

The 1st Candle of a Swing Point is mostly irrelevant.

Candle 2 - Swing Point's High/Low Creation

Candle 2 of a Swing Point.

The 2nd Candle of a Swing Point is where the Low of a Swing Low, or the High of a Swing High is found.

For a Swing Low, Candle 2 would have swept the Low of Candle 1.

For a Swing High, Candle 2 would have swept the High of Candle 1.

Candle 3 - Swing Point Confirmation

Candle 3 of a Swing Point.

The 3rd Candle of a Swing Point is what confirms the Swing Point.

It's important that for a Swing Low, the 3rd Candle doesn't touch the Low of the 2nd Candle, otherwise the Swing Low formation isn't valid.

For a Swing High, the 3rd Candle can't touch the High of the 2nd Candle, otherwise the Swing High formation isn't valid.

Candle 4 - Expansion Away From New Swing Point

Candle 4 of a Swing Point.

The 4th Candle of a Swing Point is usually an Expansion Candle away after the Reversal is confirmed.

Candle 4 is the candle we want to look for trade setups within.

Swing Point And Expansion Architecture

Swing High with Expansion and Swing Low with Expansion

Swing High/Low creation (1-3) followed by Expansion away (4+).

A Swing Point (Swing High or Swing Low) is a 3 candle pattern where the high/low of the Swing Point is formed in the 2nd candle.

Candle 4 and the candles that follow it are what we consider the Expansion Phase.

Candle 1 - Start of a new Swing Point

Candle 1 of a Swing Point.

The 1st Candle of a Swing Point is mostly irrelevant.

Candle 2 - Swing Point's High/Low Creation

Candle 2 of a Swing Point.

The 2nd Candle of a Swing Point is where the Low of a Swing Low, or the High of a Swing High is found.

For a Swing Low, Candle 2 would have swept the Low of Candle 1.

For a Swing High, Candle 2 would have swept the High of Candle 1.

Candle 3 - Swing Point Confirmation

Candle 3 of a Swing Point.

The 3rd Candle of a Swing Point is what confirms the Swing Point.

It's important that for a Swing Low, the 3rd Candle doesn't touch the Low of the 2nd Candle, otherwise the Swing Low formation isn't valid.

For a Swing High, the 3rd Candle can't touch the High of the 2nd Candle, otherwise the Swing High formation isn't valid.

Candle 4 - Expansion Away From New Swing Point

Candle 4 of a Swing Point.

The 4th Candle of a Swing Point is usually an Expansion Candle away after the Reversal is confirmed.

Candle 4 is the candle we want to look for trade setups within.

Chapter 3

How we use Swing Points and Expansions to find trades

When it comes to finding trade-able setups using our strategy, we usually want to wait for a new Swing Point to be confirmed (with the exception of a CRT Candle formation), signalling a Reversal.

Then we look within the 4th Candle for trade setups on the lower timeframes, with the expectation that the candle will develop as an Expansion Candle.

There are 3 important candle formation frameworks that we need to understand when it comes to trading Reversals and Expansions:

We will be covering each of these frameworks individually in the next few lessons.

Chapter 4

A Reversal Move occurs when a new Swing Point formation is created after mitigating a Key Level.

Swing High and Swing Low Reversals

Bullish and Bearish Reversals.

If price creates a Swing High formation after mitigating a Key Level, we read this is a Bearish Reversal Signal, meaning after a Swing High has formed after hitting a Key Level, we expect price to then enter a new Bearish Expansion Phase, targeting a new Sell-Side Draw on Liquidity target.

If price creates a Swing Low formation after mitigating a Key Level, this is a Bullish Reversal Signal, meaning after a Swing Low has formed after hitting a Key Level, we expect price to then enter a new Bullish Expansion Phase, targeting a new Buy-Side Draw on Liquidity target.


A Reversal Move occurs when a new Swing Point formation is created after mitigating a Key Level.

Swing High and Swing Low Reversals

Bullish and Bearish Reversals.

If price creates a Swing High formation after mitigating a Key Level, we read this is a Bearish Reversal Signal, meaning after a Swing High has formed after hitting a Key Level, we expect price to then enter a new Bearish Expansion Phase, targeting a new Sell-Side Draw on Liquidity target.

If price creates a Swing Low formation after mitigating a Key Level, this is a Bullish Reversal Signal, meaning after a Swing Low has formed after hitting a Key Level, we expect price to then enter a new Bullish Expansion Phase, targeting a new Buy-Side Draw on Liquidity target.


Chapter 5

Expansion after a Reversal

When a new Swing Point is created after mitigating a Key Level, we then anticipate an Expansion Move, targeting a new Draw on Liquidity.

Expansion after mitigating Draw on Liquidity and creating a new Swing Point.

Remember, the Draw on Liquidity is always a Liquidity Pool, which means it can either be a previous Swing High/Swing Low (ERL), or a Fair Value Gap (IRL).

Expansion after a Reversal

When a new Swing Point is created after mitigating a Key Level, we then anticipate an Expansion Move, targeting a new Draw on Liquidity.

Expansion after mitigating Draw on Liquidity and creating a new Swing Point.

Remember, the Draw on Liquidity is always a Liquidity Pool, which means it can either be a previous Swing High/Swing Low (ERL), or a Fair Value Gap (IRL).

Chapter 6

The benefit for having a Daily Bias is that depending on whether we are Bullish or Bearish, we can use our frameworks it offers us criteria for how we might expect the new Daily Candle to develop c

purpose of a Daily Bias comes down to determining how the market will move compared to the previous Daily Candle.

We develop our Daily Bias through analysing the chart on the Daily timeframe by looking at the market structure and weighing up the Bullish and Bearish arguments to decide whether we are going to side with the buyers or the sellers for the day.


The Daily Bias Checklist

When we develop our Daily Bias, we go through a 2 step process:

  • Find the Current Daily Draw On Liquidity Target.

  • Apply the context of the Previous Daily Candle.


the bias we build for whether we believe the price action within the new daily candle will be bullish or bearish, based on our Draw on Liquidity analysis and analysing the previous daily candle.

The first step is to look at the overall market structure of the daily timeframe to understand what we believe the current DOL target is, we covered how we look for the current DOL in the previous chapter.

After we understand where we think the market is looking to target in general, we can then analyse the previous daily candle and form a trade plan for the day.

When forming a daily bias, what we are actually trying to predict is how the daily candle will look when it closes, so really we are only trying to theorise between 2 outcomes:

  • Will the new Daily Candle close as a Bullish (Green) Candle?

  • Will the new Daily Candle close as a Bearish (Red) Candle?

We develop our daily bias perspective based on 2 things:

  • Current phase of price action (reversal or expansion).

  • Previous daily candle.

The current phase of price action gives us our external context, which is the overall directional bias that the market is most likely to follow based on the external market structure.

The previous daily candle gives us the most immediate signal for what the market is wanting to do, which will provide a massive amount context for what is most likely to happen in the next immediate trading day.


Step 1: What Phase is the Daily Chart in? (DOL)

The first step of finding a Daily Bias is to work out if the Daily timeframe chart is currently in either an Expansion Phase, or a potential Reversal Phase .

The objective of this is to find out what the current Draw on Liquidity is for the Daily timeframe.

Which way is the market pushing?

For determining whether the market is in an Expansion Phase, we first want to mark out the most recently mitigated Daily Key Level (Daily Swing High/Low or Daily FVG).

From here we can then ask the question: "Did we create a Continuation (Expansion Candle) or a Reversal (Swing Point)?"

If price created a Continuation Move after hitting the most recent Daily Key Level, we can expect further Expansion to the next Key Level further in that direction.

If price created a new Daily Swing Point after hitting the most recent Daily Key Level,

Did the previous Daily Candle hit a Daily Key Level?


We can achieve this by working through some questions.

Has the market already hit a Daily Key Level (Daily Swing High/Low or Daily FVG) in it's most recent leg?