
CRT Candles
CRT Candles are used as one of the methods for detecting a momentum reversal signal.
What is a CRT Candle?
As mentioned in the Candle Closures chapter, a CRT Closure occurs as a result of a failed push by buyers/sellers with a strong rejection pushback, which is made evident by a large wick.
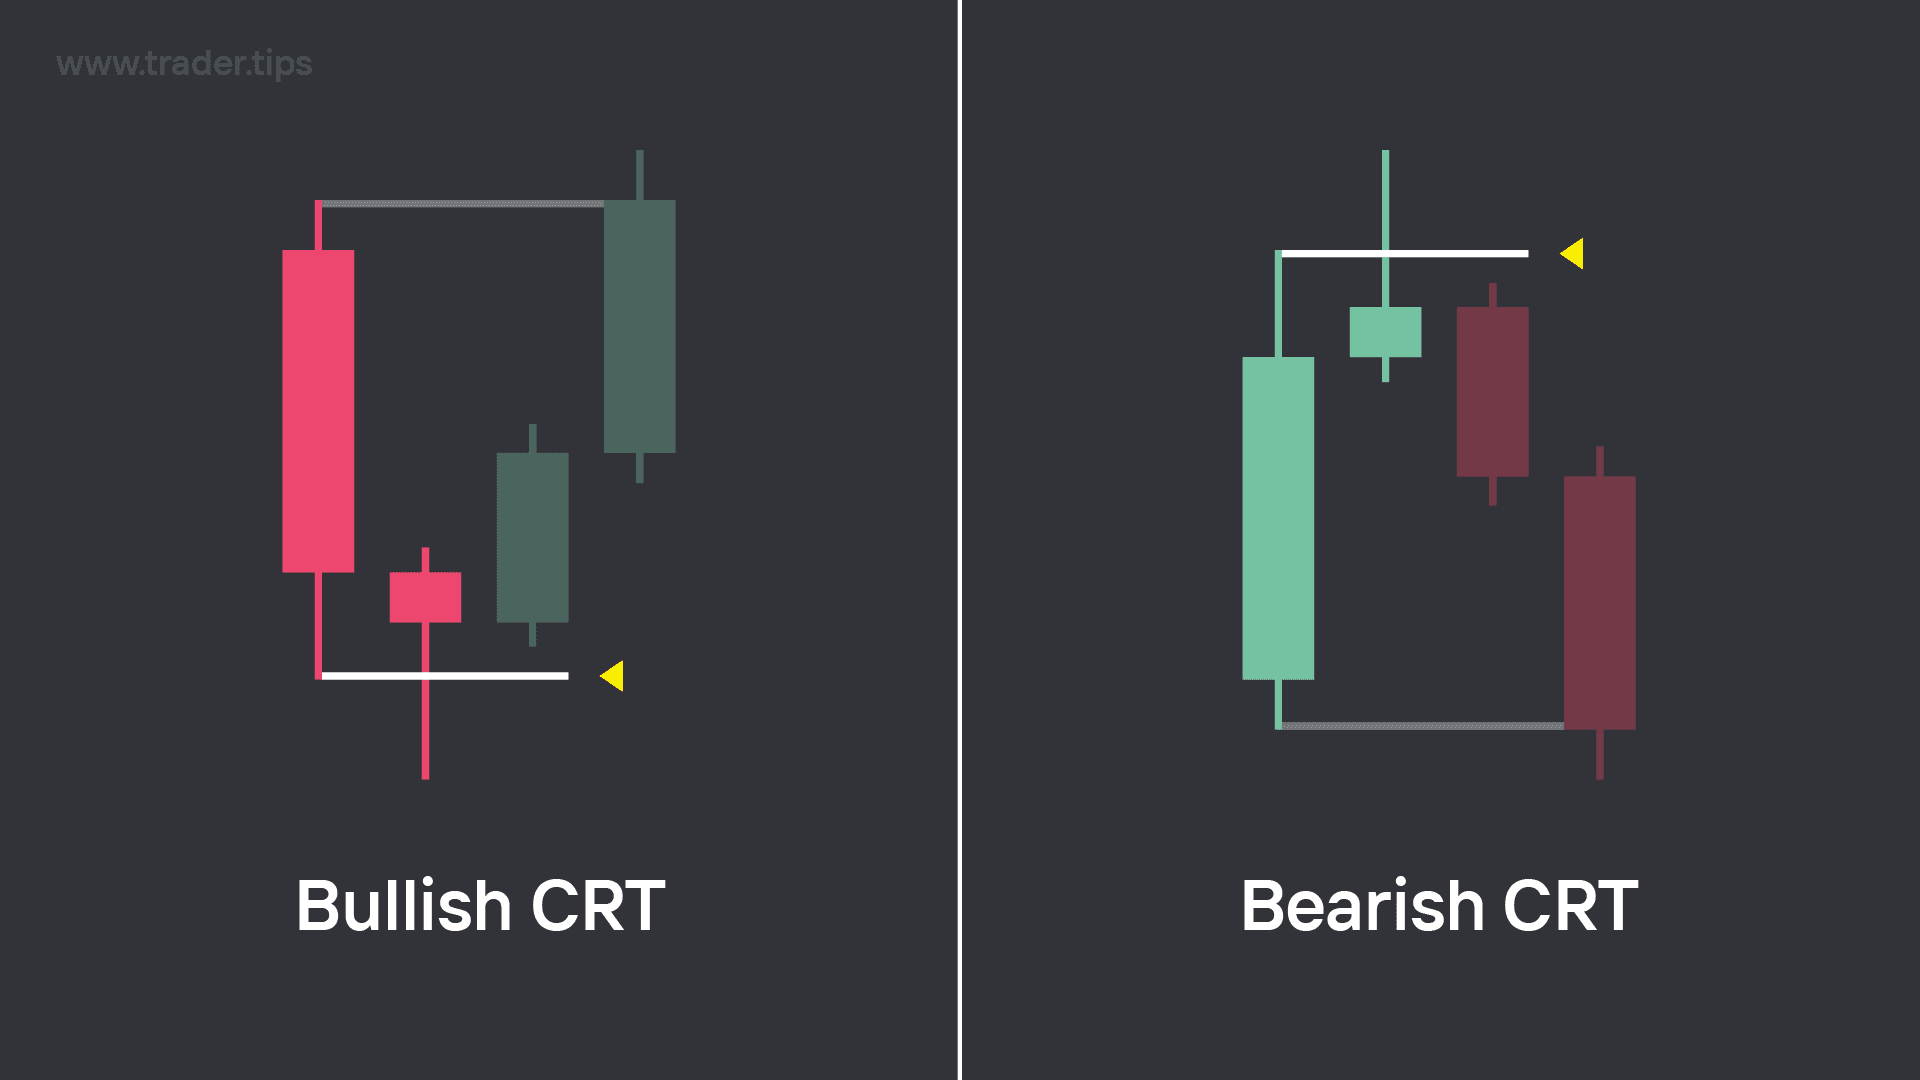
Example of a Bullish CRT candle and a Bearish CRT candle.
The name 'CRT' is borrowed from a concept called 'Candle Range Theory'.
What is Candle Range Theory (CRT)?
Candle Range Theory is a concept idea that suggests that when a candle pushes past the previous candle's top wick or bottom wick, and then returns back and closes within the previous candle's range, the next most likely target will be the other unmitigated wick of that candle.
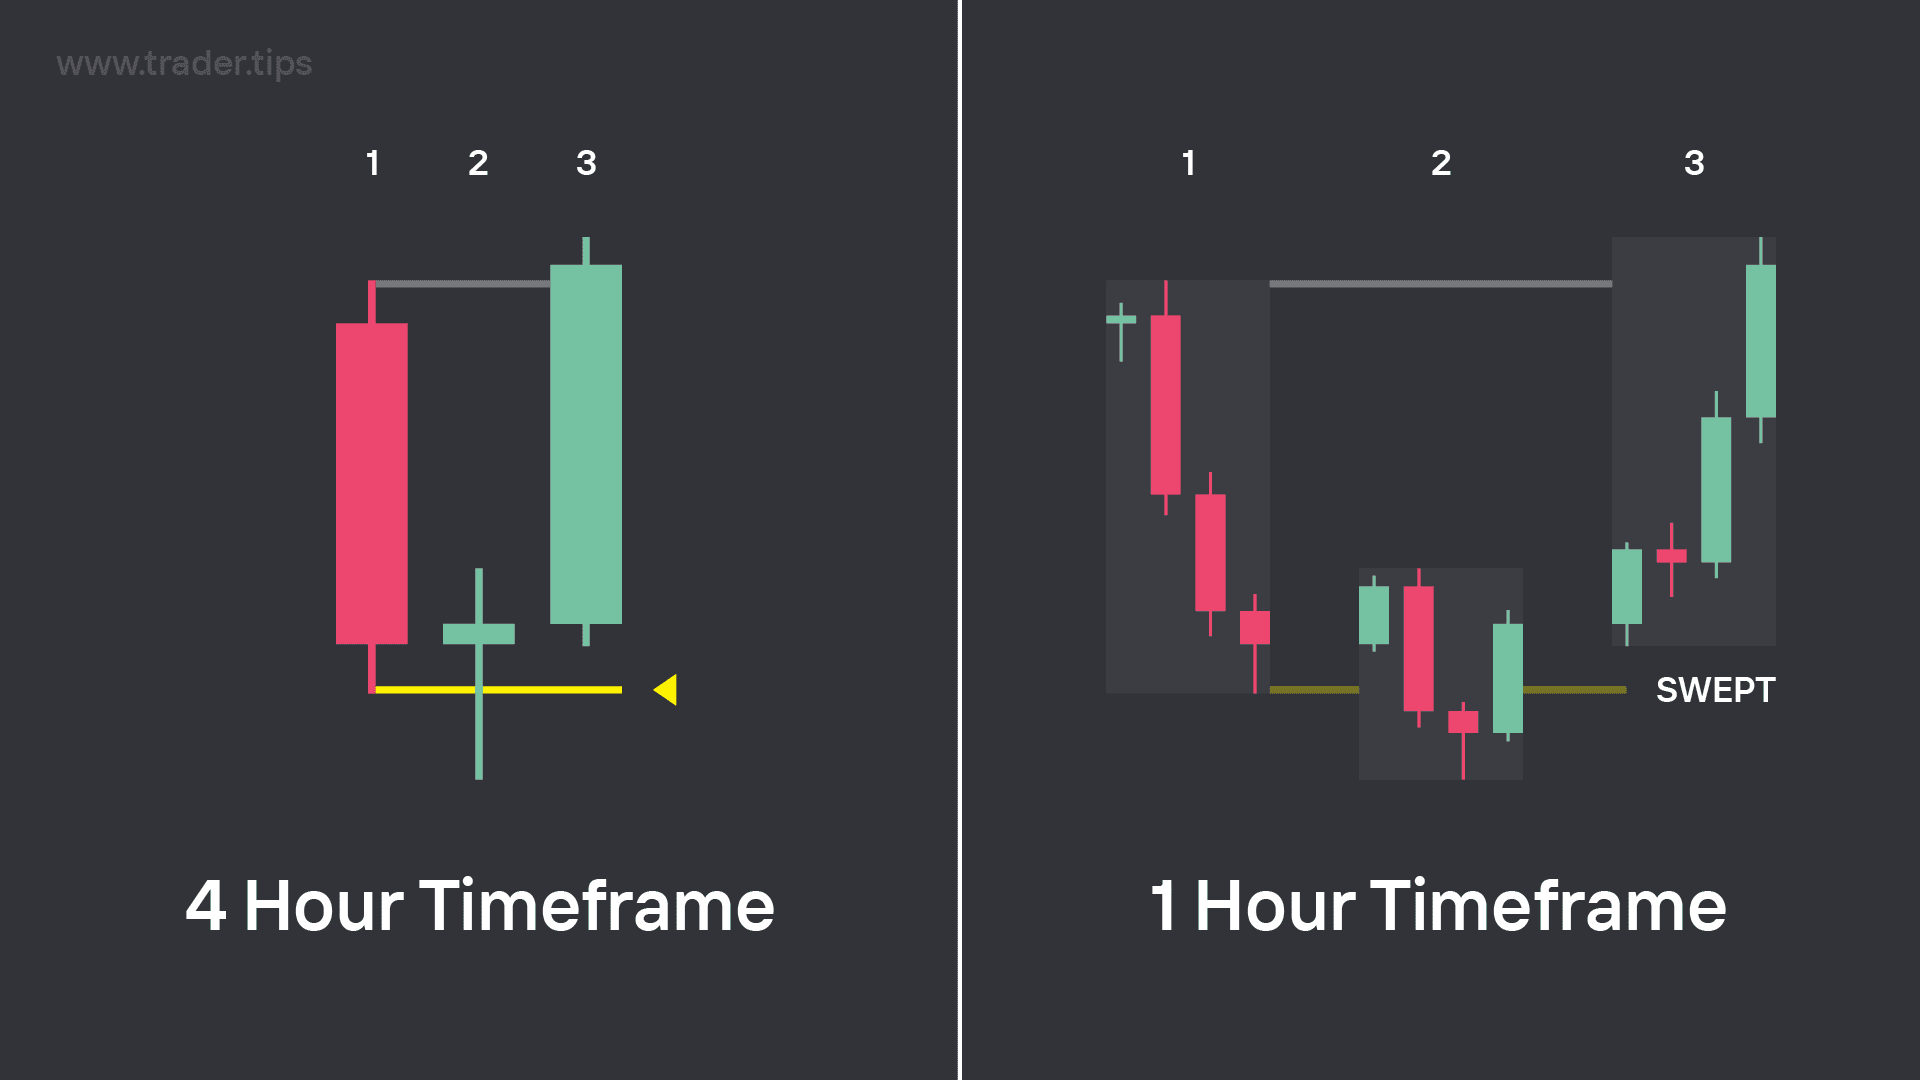
4 Hour Timeframe CRT Setup viewed through the 1 Hour Timeframe.
We covered in an earlier chapter that each candle possesses its own range spanning from its high to its low. This range is much easier to see when viewed on a lower timeframe.
When the range of a candle is swept, with Candle Range Theory we consider it a signal of a potential reversal, where the next target that price will be drawn to is the opposing unswept high/low.
A CRT Candle is based on this theory idea by specifically looking for this wick rejection move in the 2nd higher timeframe candle, with the goal of finding a trade-able setup in the 3rd higher timeframe candle.
Bullish CRT Candle
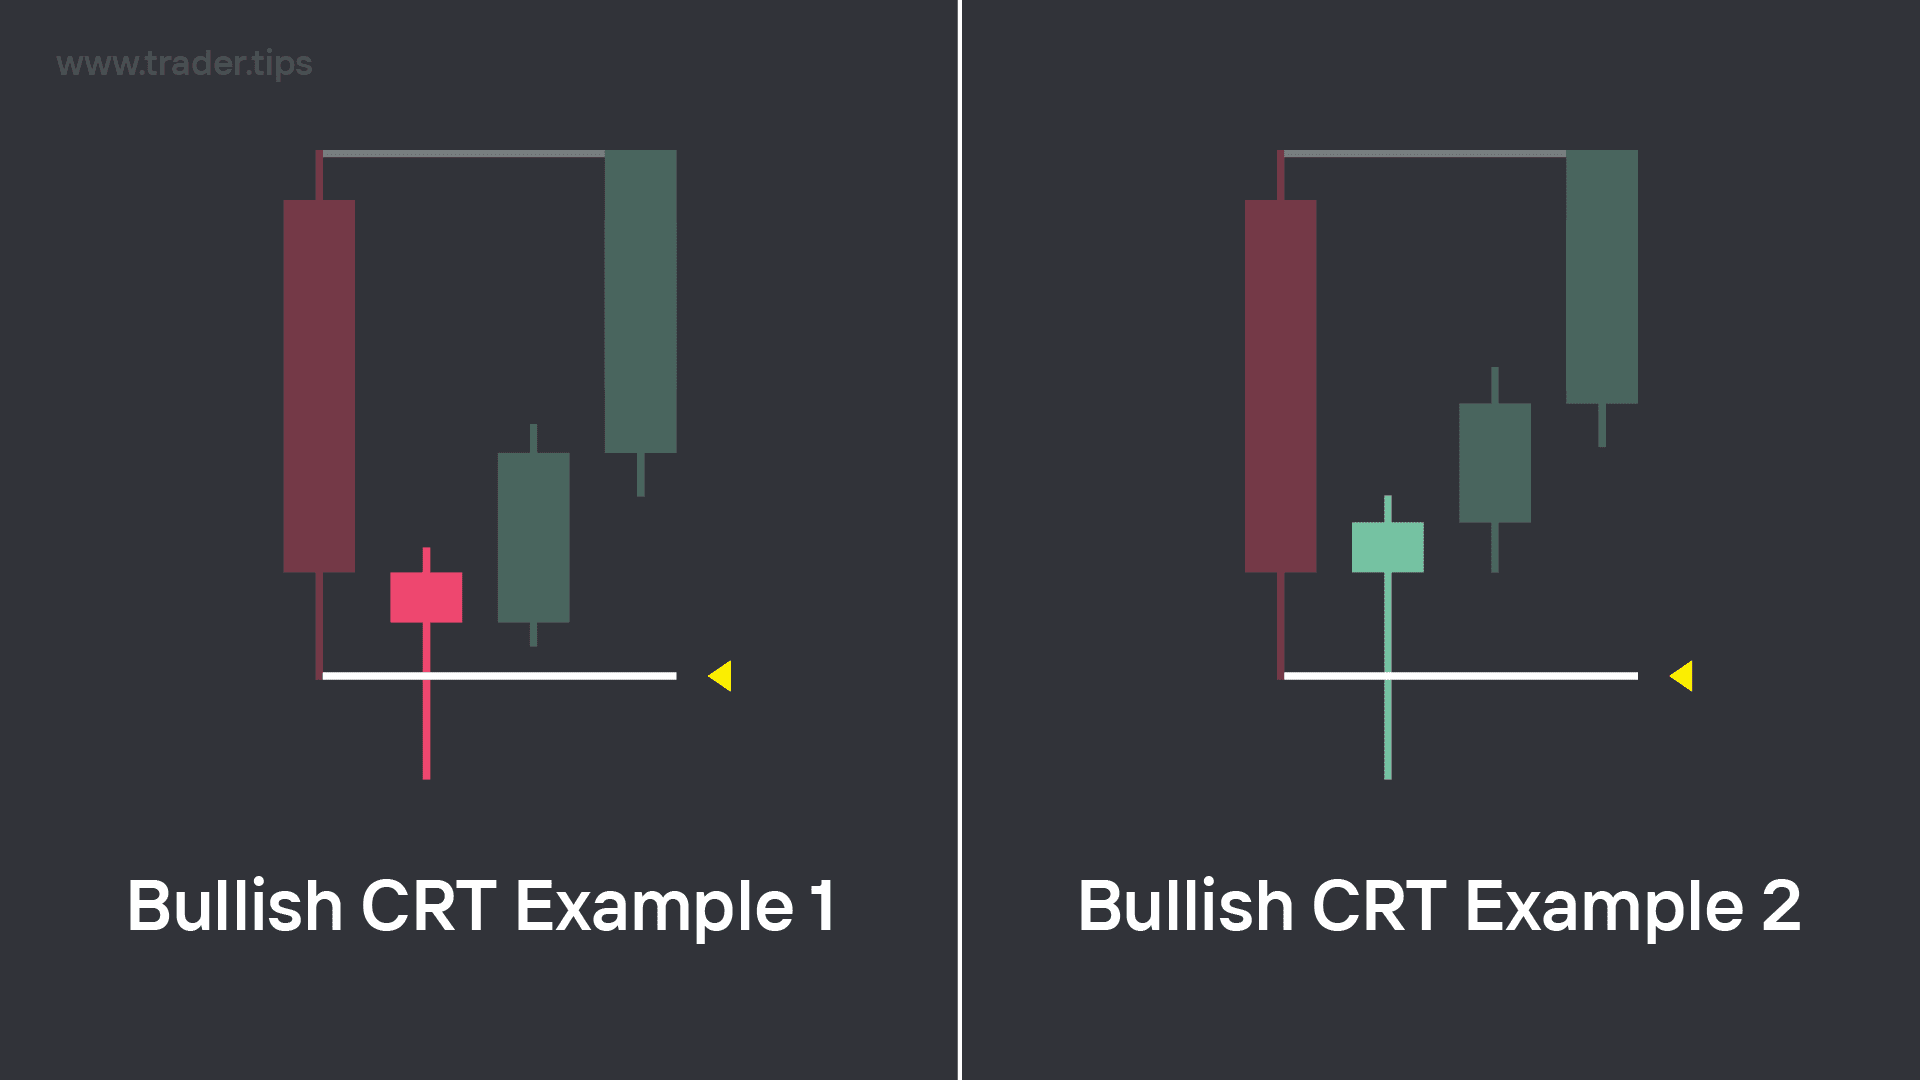
Bullish CRT Candle Examples.
For a Bullish CRT candle, we would be looking to see the 2nd candle push through the 1st candle's low, before then returning back up to close within the previous candle's range (between the high and low).
This will typically result in a large bottom wick in the 2nd candle, which is a bullish rejection signal that tells us that the sellers failed to push the move lower.
It doesn't matter if the Bullish CRT candle closes as a bullish or bearish candle, what's important is if it fits the criteria or sweeping the low and closing back within the range.
After a Bullish CRT candle is created, we expect to see bullish expansion in the following candle(s).
Bearish CRT Candle
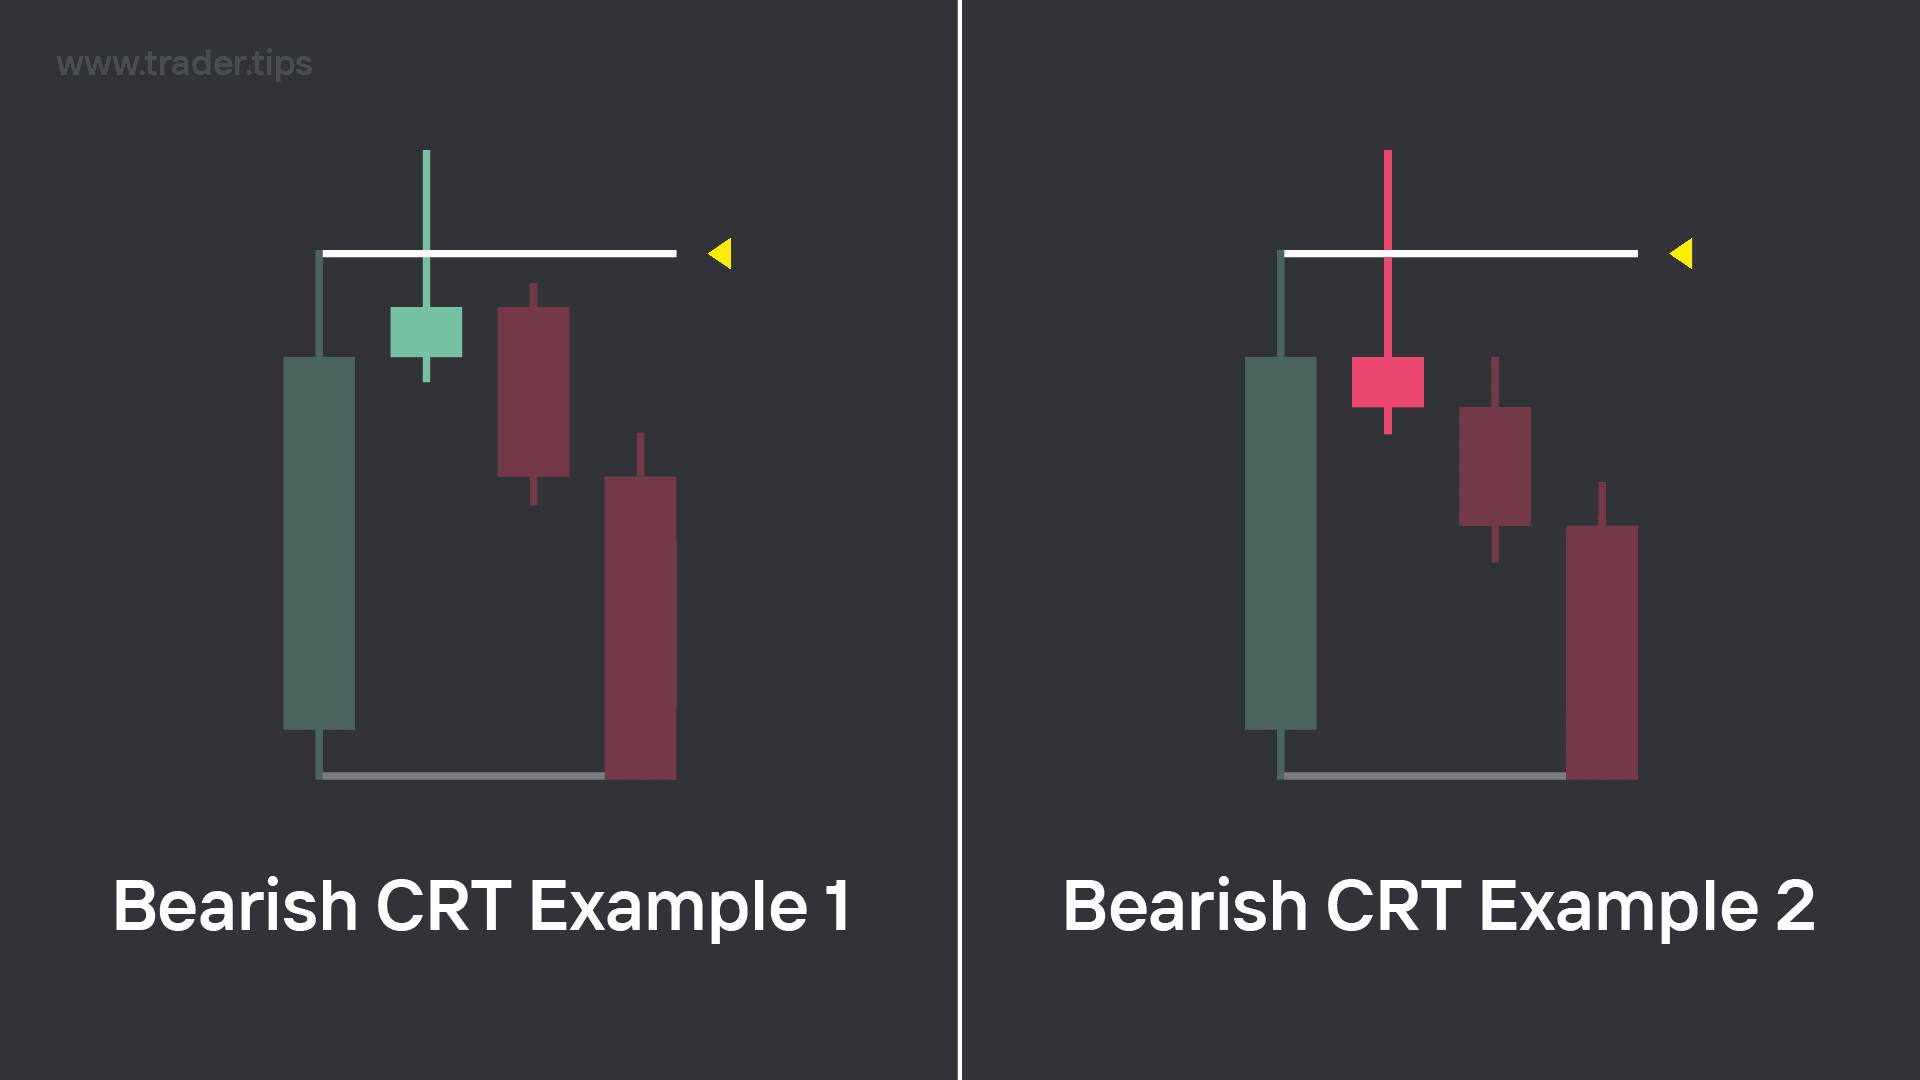
Bearish CRT Candle Examples.
For a Bearish CRT candle, we would be looking to see the 2nd candle push through the 1st candle's high, before then returning back down to close within the previous candle's range (between the high and low).
This will typically result in a large top wick in the 2nd candle, which is a bearish rejection signal that tells us that the buyers failed to push the move higher.
It doesn't matter if the Bearish CRT candle closes as a bullish or bearish candle, what's important is if it fits the criteria or sweeping the high and closing back within the range.
After a Bearish CRT candle is created, we expect to see bearish expansion in the following candle(s).
How are CRT Candles signals useful?
Reversals in a market's orderflow are identified by the creation of a new swing point.
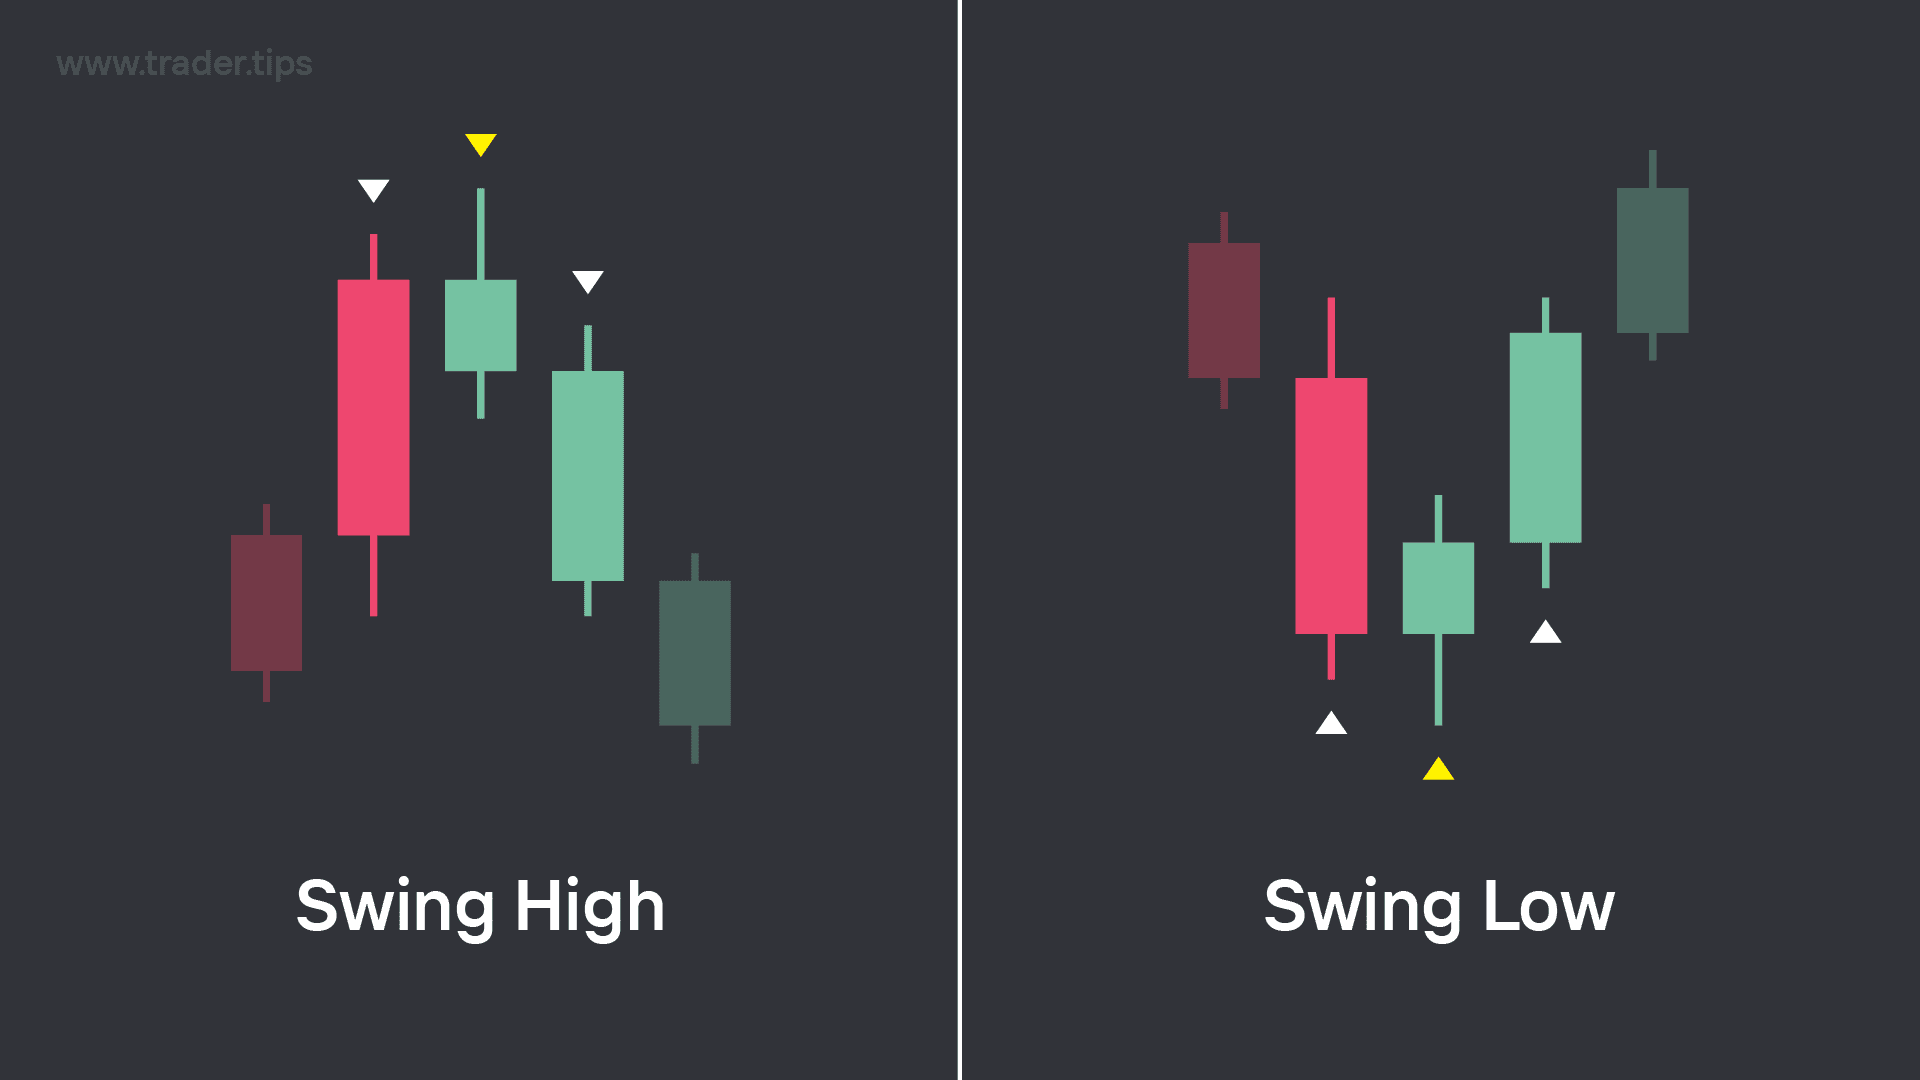
Example of a Swing High and a Swing Low.
Swing Highs and Swing Lows are really just 3 candle patterns.
A swing high is a 3 candle pattern where the middle candle's top wick is higher than the top wicks of both the candle to it's left, and to it's right
A swing low is a 3 candle pattern where the middle candle's bottom wick is lower than the bottom wicks of the candles to it's left, and to it's right.
A CRT Candle formation is used to try and identify when that middle candle has formed in the 3-candle series of a swing high or swing low, before the swing point has actually been confirmed.
Bullish CRT Candle Swing formations
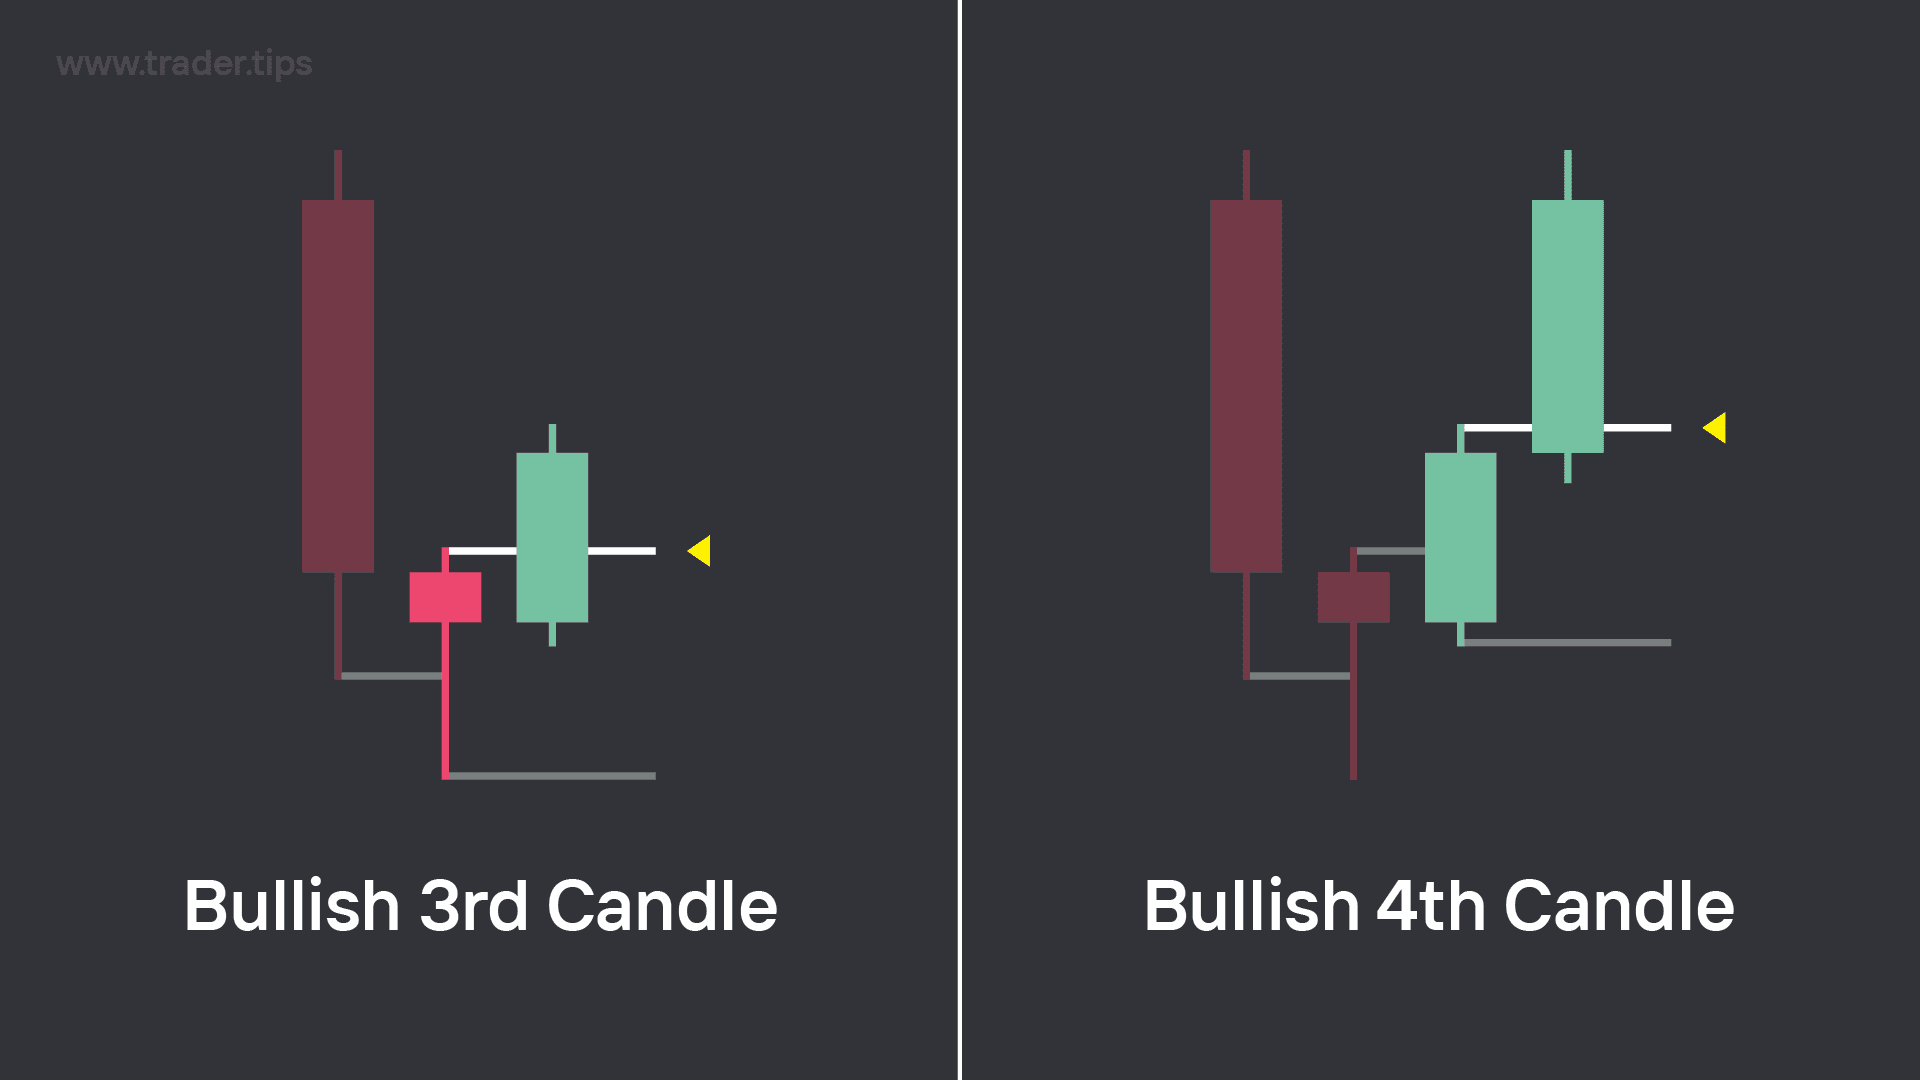
Bullish Expansion in the 3rd and 4th candles after Bullish CRT confirmation.
With this bullish CRT Candle formation in the 2nd candle, we would then be anticipating the next candle to be a bullish Expansion Candle that pushes up and closes above the top wick of the CRT Candle, whilst also respecting the lower wick of the CRT Candle.
This Expansion Candle (3rd Candle) is what confirms the swing low. When this type of formation occurs, we will usually expect the 4th candle of the sequence to be another Expansion Candle higher.
Bullish CRT Candle Swing formations
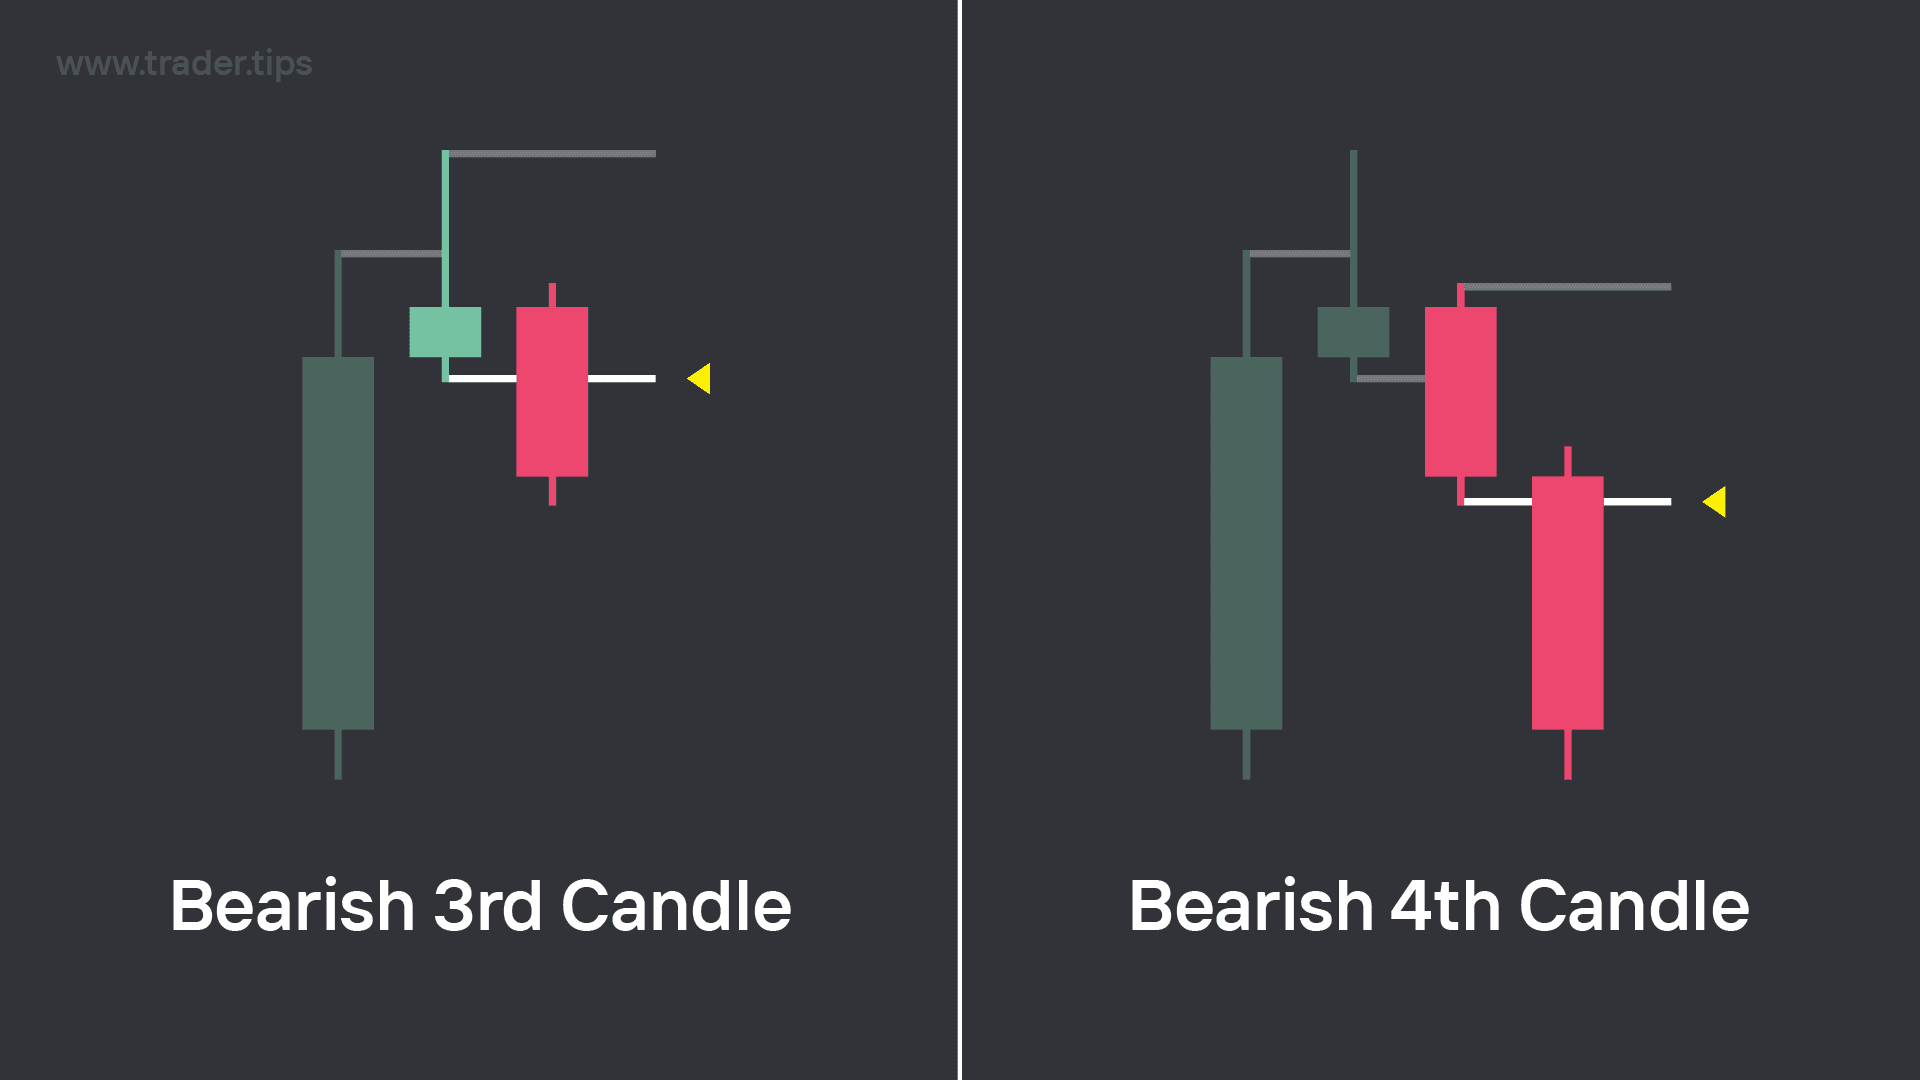
Bearish Expansion in the 3rd and 4th candles after Bearish CRT confirmation.
With this bearish CRT Candle formation in the 2nd candle, we would then be anticipating the next candle to be a bearish Expansion Candle that pushes down and closes below the bottom wick of the CRT Candle, whilst also respecting the top wick of the CRT Candle.
This Expansion Candle (3rd Candle) is what confirms the swing high. When this type of formation occurs, we will usually expect the 4th candle of the sequence to be another Expansion Candle lower.
Trading CRT Swing Formations
When it comes to trading a swing high/low that is forming from a CRT candle, there are 2 choices:
Finding a setup during the 3rd (Expansion) candle on a lower timeframe, after the CRT candle confirmation.
Finding a setup in the 4th (Expansion) candle on a lower timeframe, once the 3rd candle has confirmed the swing point.
Equilibrium of Expansion Candles
When trading these setups, one of the confluences we can use is making sure that the Equilibrium Levels of the previous candles are being respected, because this signals strength in the reversal move, giving us confidence that the swing is successfully forming.
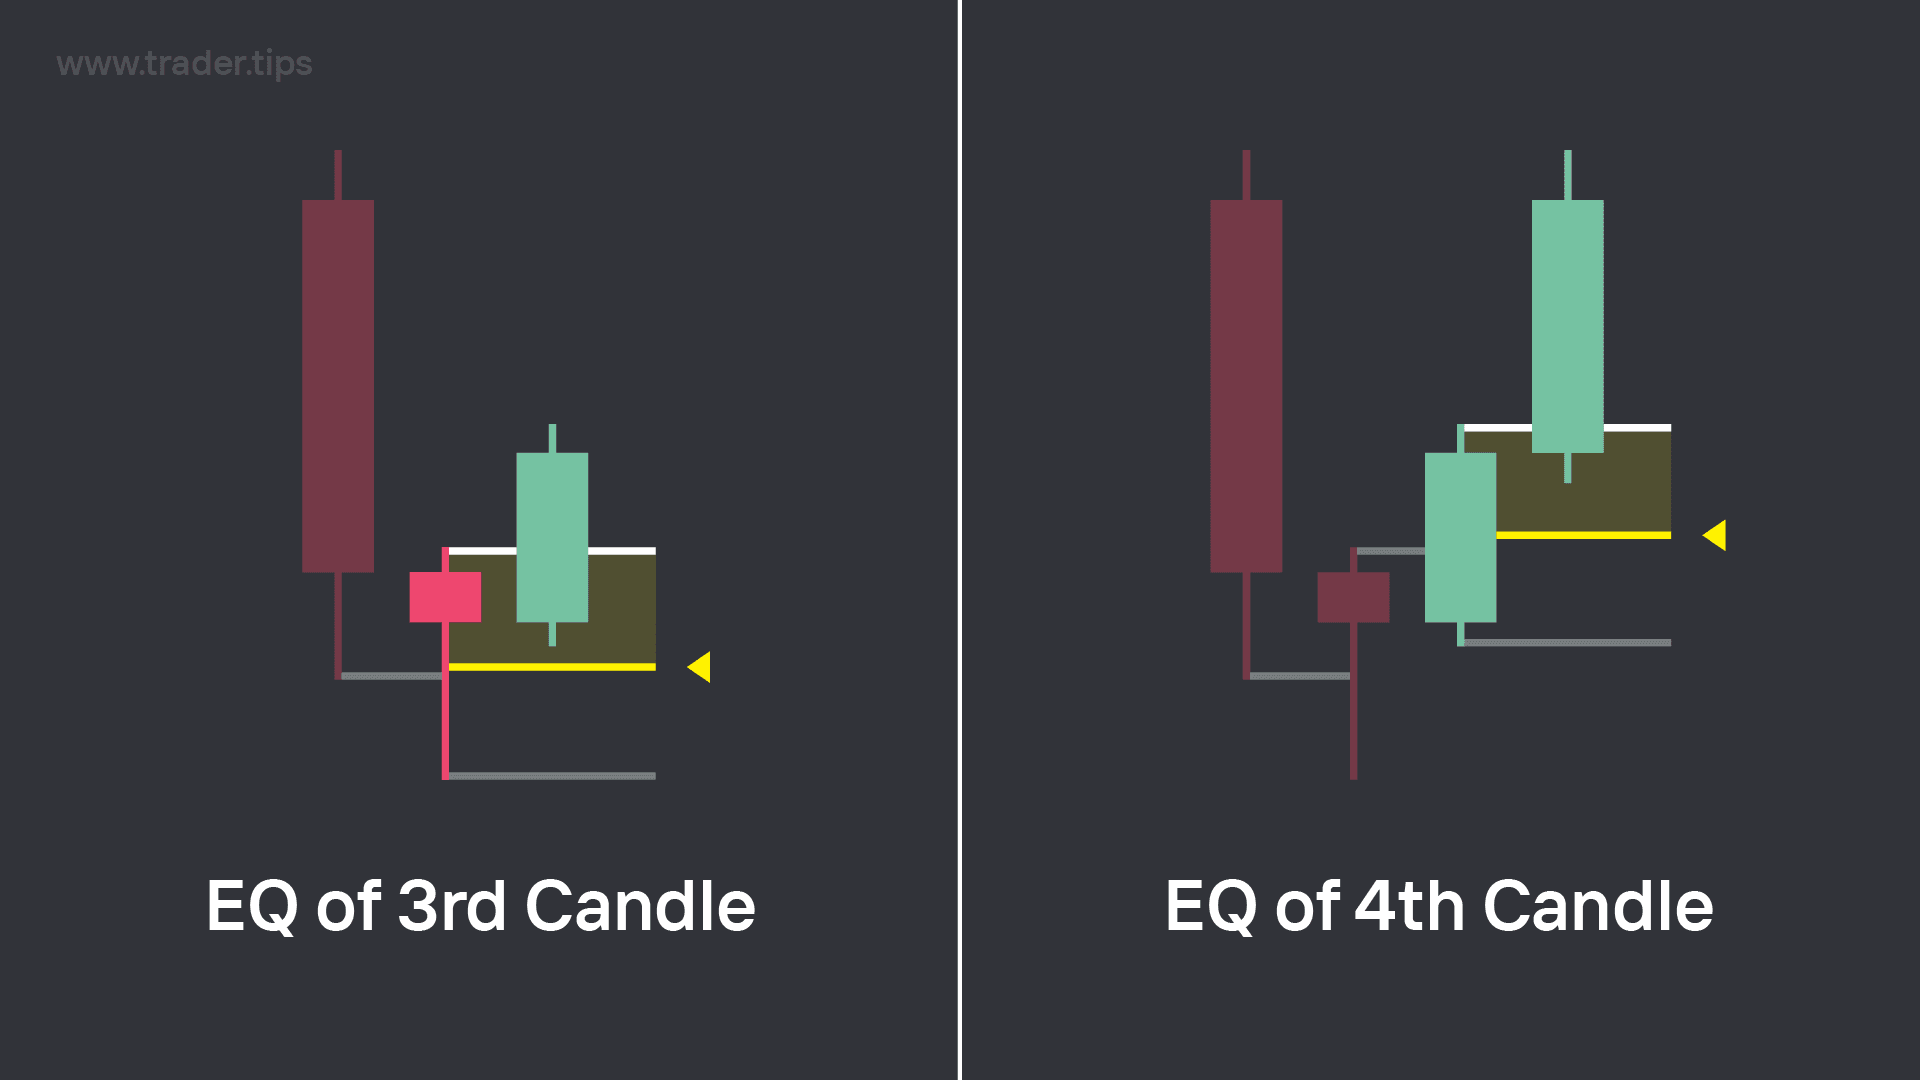
Equilibrium of Bullish Expansion candles after a Bullish CRT formation.
If we want to find setups within the candles following the Bullish CRT confirmation, we would ideally want to see the candles respect the Equilibrium of the previous candle.
If we see the bottom wick form above the Equilibrium, this signals strong bullish strength.
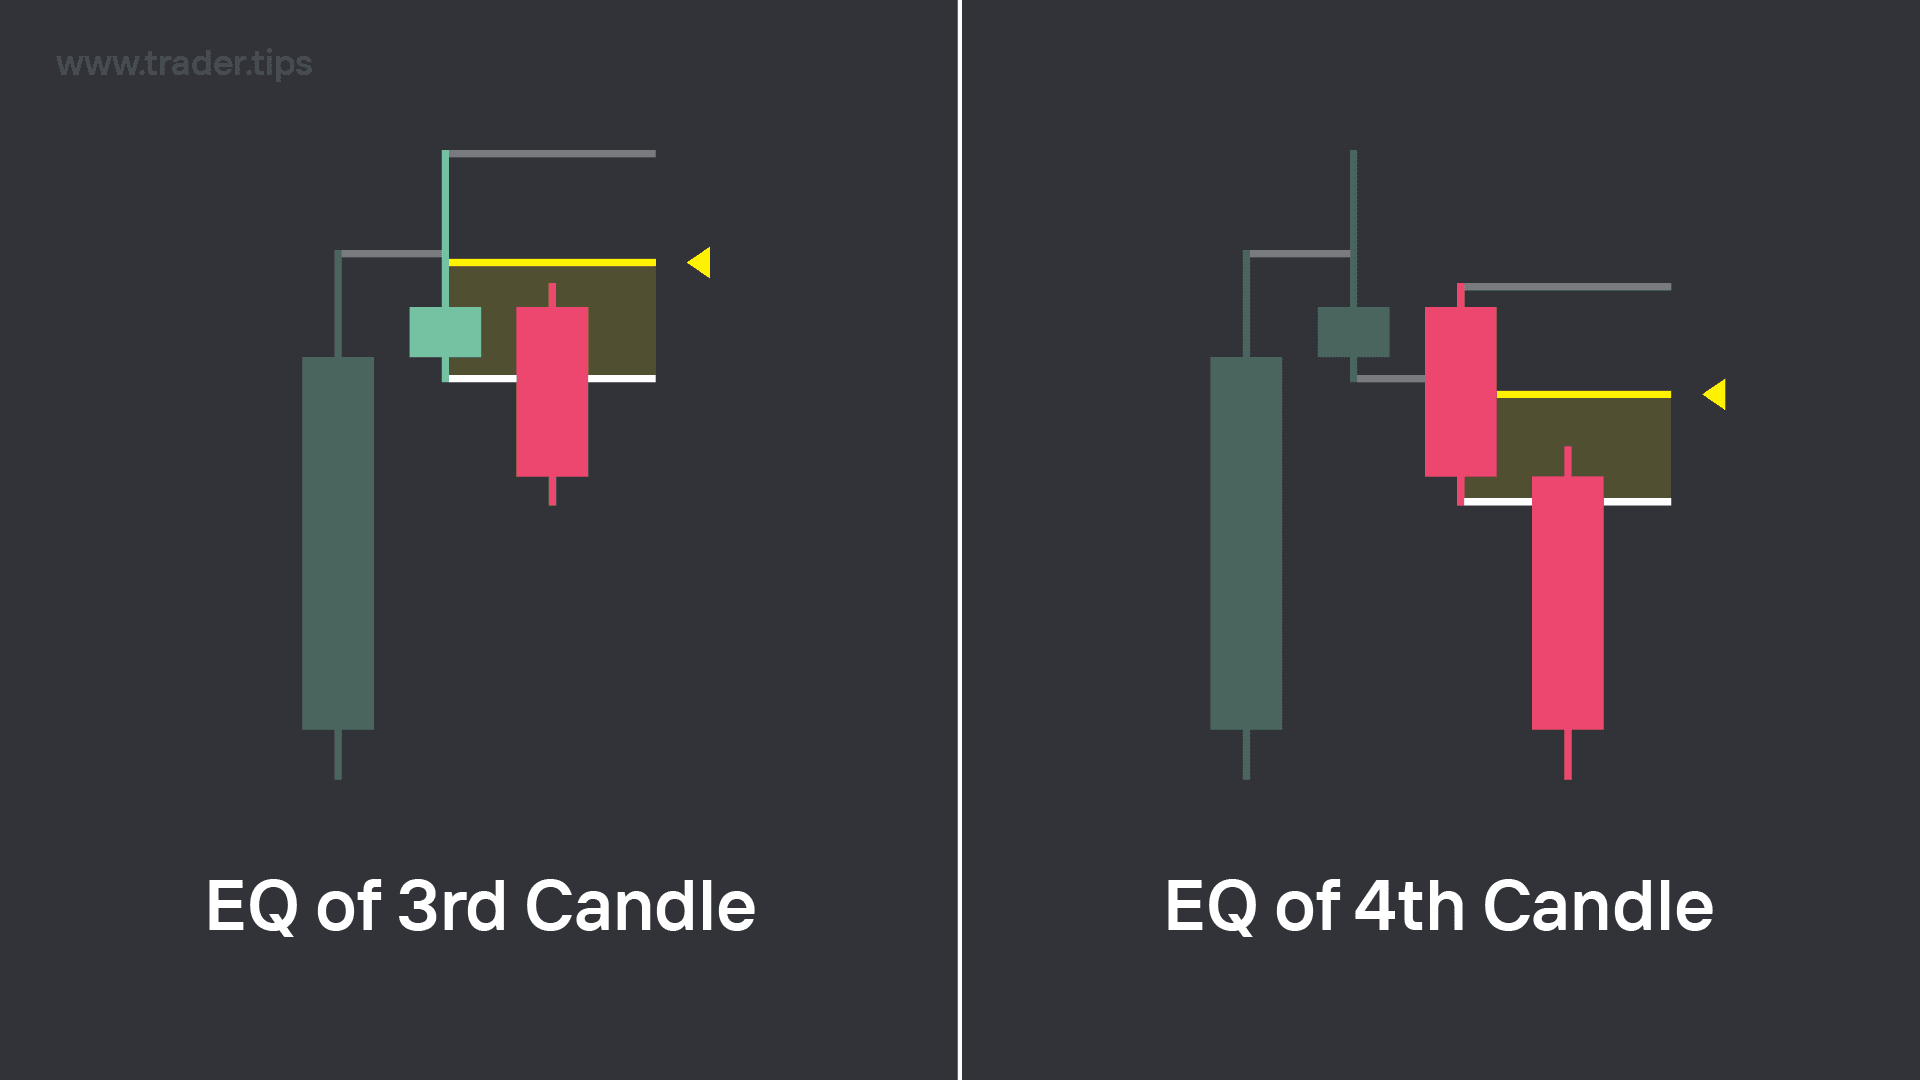
Equilibrium of Bearish Expansion candles after a Bearish CRT formation.
If we want to find setups within the candles following the Bearish CRT confirmation, we would ideally want to see the candles respect the Equilibrium of the previous candle.
If we see the top wick form below the Equilibrium, this signals strong bearish strength.
When is a CRT formation invalidated?

Invalidations of a Bullish CRT formation and a Bearish CRT formation.
With the idea behind a CRT candle formation being that we are attempting to predict the 2nd candle of a 3 candle swing point, in order for the CRT formation to be valid, the external wick of the CRT candle must not be touched or the formation is invalidated.
This means for a Bullish CRT candle, invalidation would occur if price hits the bottom of the lower wick.
For a Bearish CRT candle, invalidation would occur if price hits the top of the upper wick.
What are the targets for a CRT formation setup?
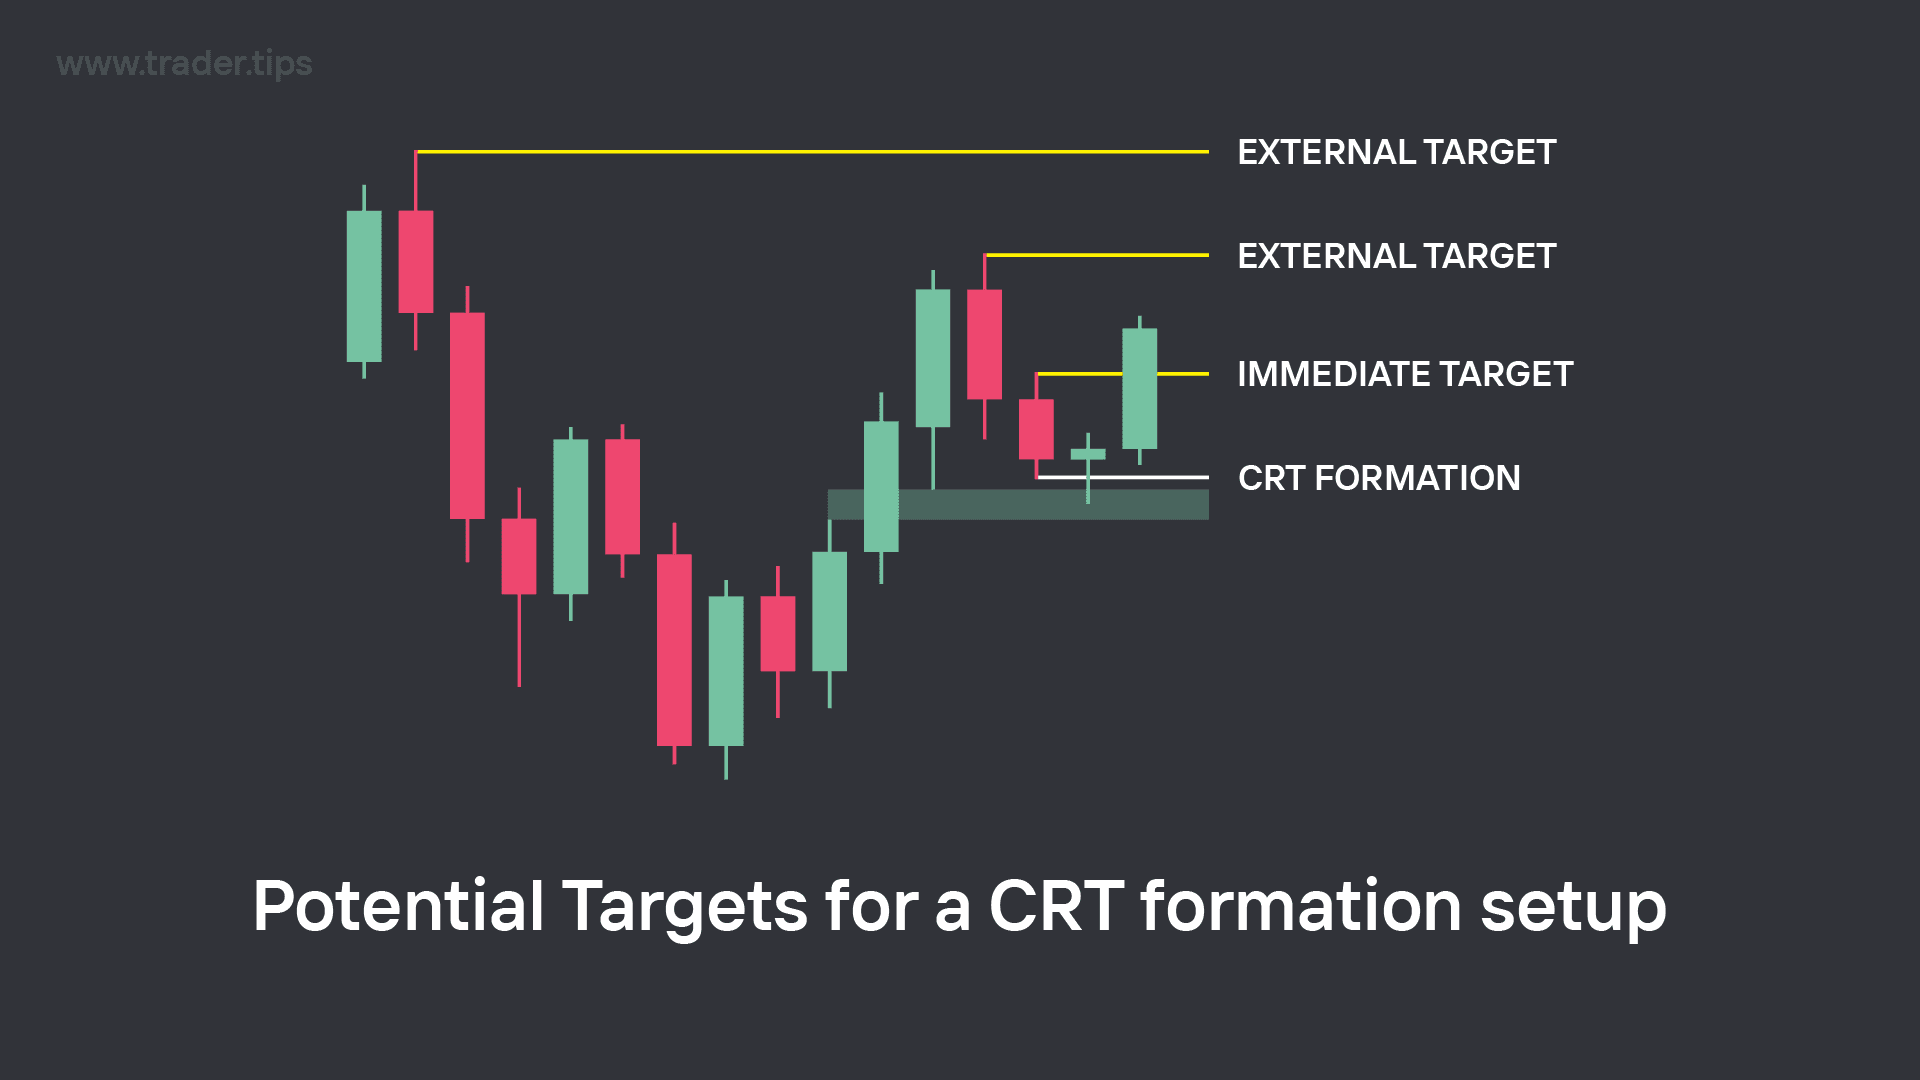
Potential Targets for a Bullish CRT formation setup.
The concept of Candle Range Theory is that if a candle pushes through the wick of the previous candle before it and then closes back within it's range, the next immediate target will the be the other wick of that previous candle.
So this means the immediate target of a CRT formation would be the opposite wick of the targeted candle that has created the range.
But with us also using CRT formations to confirm a Swing High or Swing Low, we can extend our targets to more external targets, like a Liquidity Level or a Fair Value Gap.
Confirming HTF CRT Formations with LTF CISDs
The best way to use CRT formations as trade setups is to use higher timeframe CRT formations with lower timeframe setup confirmations and entries.
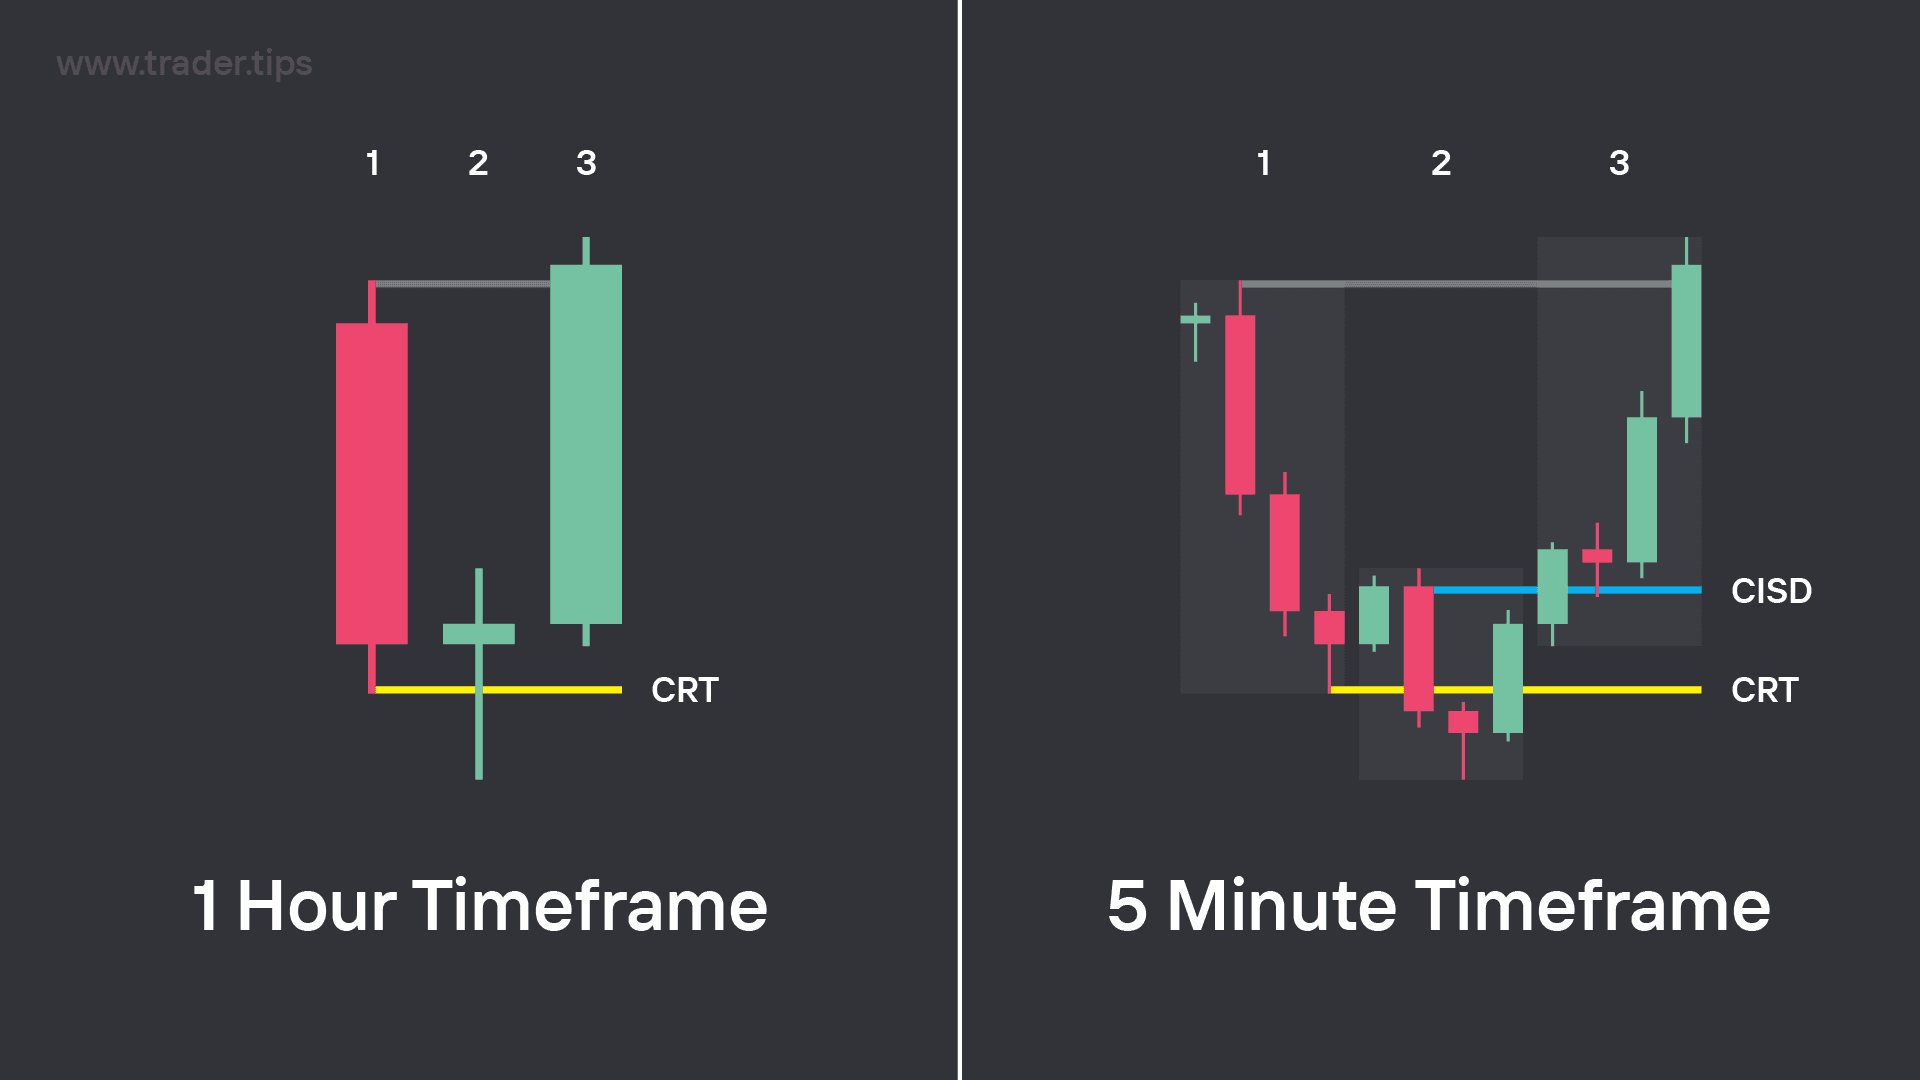
5m CISD confirmation inside 1H CRT formation.
For example, in the image above on the left hand side, we have an example of a 1 Hour Bullish CRT formation.
So this means we might now expect the next candle to be bullish, confirming a new swing low has formed.
However, we don't want to blindly enter a long trade purely based on this CRT candle. We need to see some other bullish confirmation that supports our bullish bias.
This is where we can go down to a lower timeframe, such as the 5 Minute timeframe in this case, to analyse how the market structure is forming.
What we are specifically looking for on this lower 5 Minute timeframe is a 5 Minute CISD in either the CRT candle, or the next candle after it.
CISDs are used as reversal signals. In the image above on the right side, we can see we have a Bullish 5 Minute CISD, which means that the market structure's behaviour has now switched to bullish on the 5 Minute timeframe.
This is the lower timeframe confirmation we are looking for, to confirm the Bullish 1 Hour timeframe CRT formation.
From here, we can then look for a 5 Minute PD Array to use as an entry setup, such as a Fair Value Gap, or even the CISD itself.
If there is no lower timeframe CISD, we will ignore the CRT formation for any potential trade setups.
This is just a simple example, we will be covering this further in other chapters.
Avoid CRT formations that have Conflicting Bias
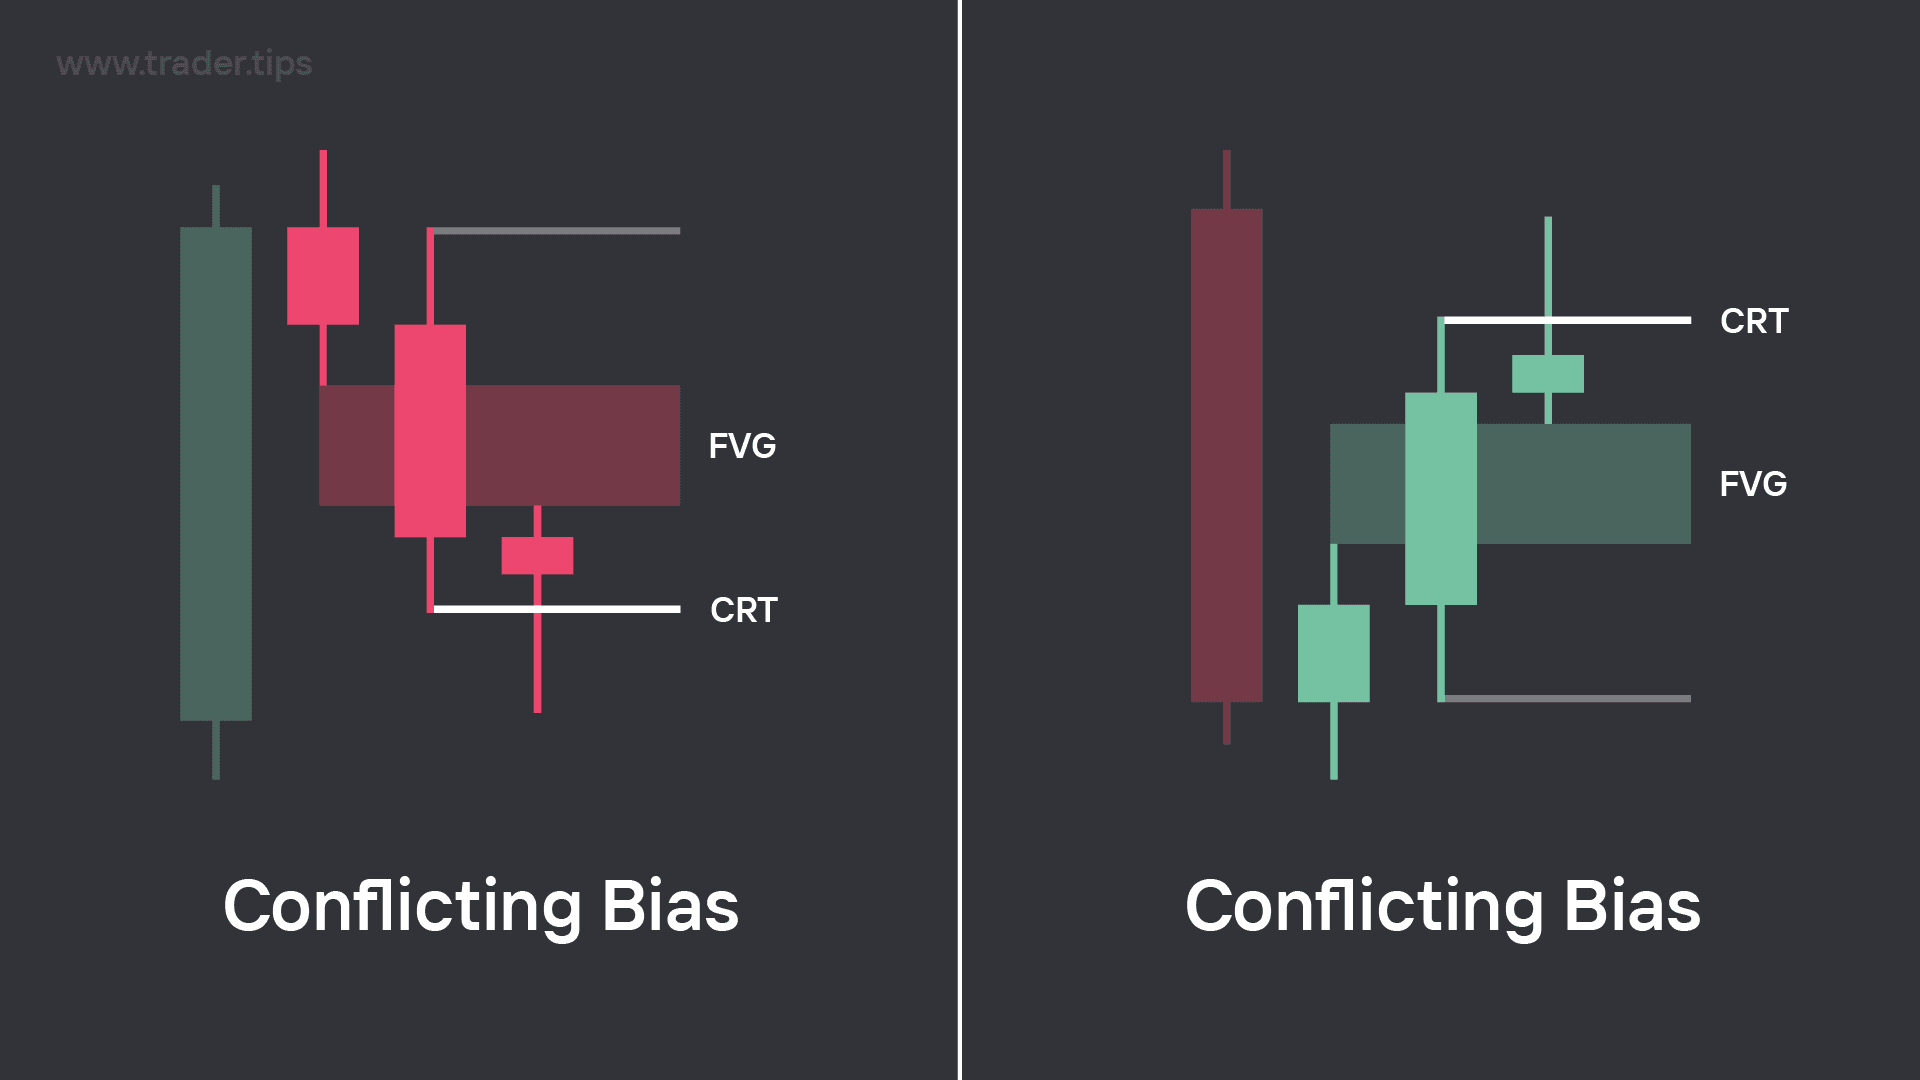
Examples of Bullish and Bearish CRT formations with conflicting bias due to FVG creations.
If a CRT candle forms whilst also being the 3rd candle within the 3 candle sequence of a Fair Value Gap, this is what we call conflicting bias.
The creation of a CRT candle signals is considered a reversal signal.
But, the creation of a Fair Value Gap is considered a continuation signal, as in it can be used as support (Bullish FVG) or resistance (Bearish FVG) to create the next swing point in a trend.
In the image above, we have an example of a Bullish CRT Candle also creating a Bearish Fair Value Gap, and an example of a Bearish CRT Candle also creating a Bullish Fair Value Gap.
In both cases, these are scenarios that contain a conflicting directional bias.
The only reasonable way to determine what price might want to do is to wait and see which out of the Fair Value Gap and the CRT Candle is disrespected first.
Until we have some kind of directional bias confirmation, we should avoid trading.
CRT formation with iFVG Confirmation
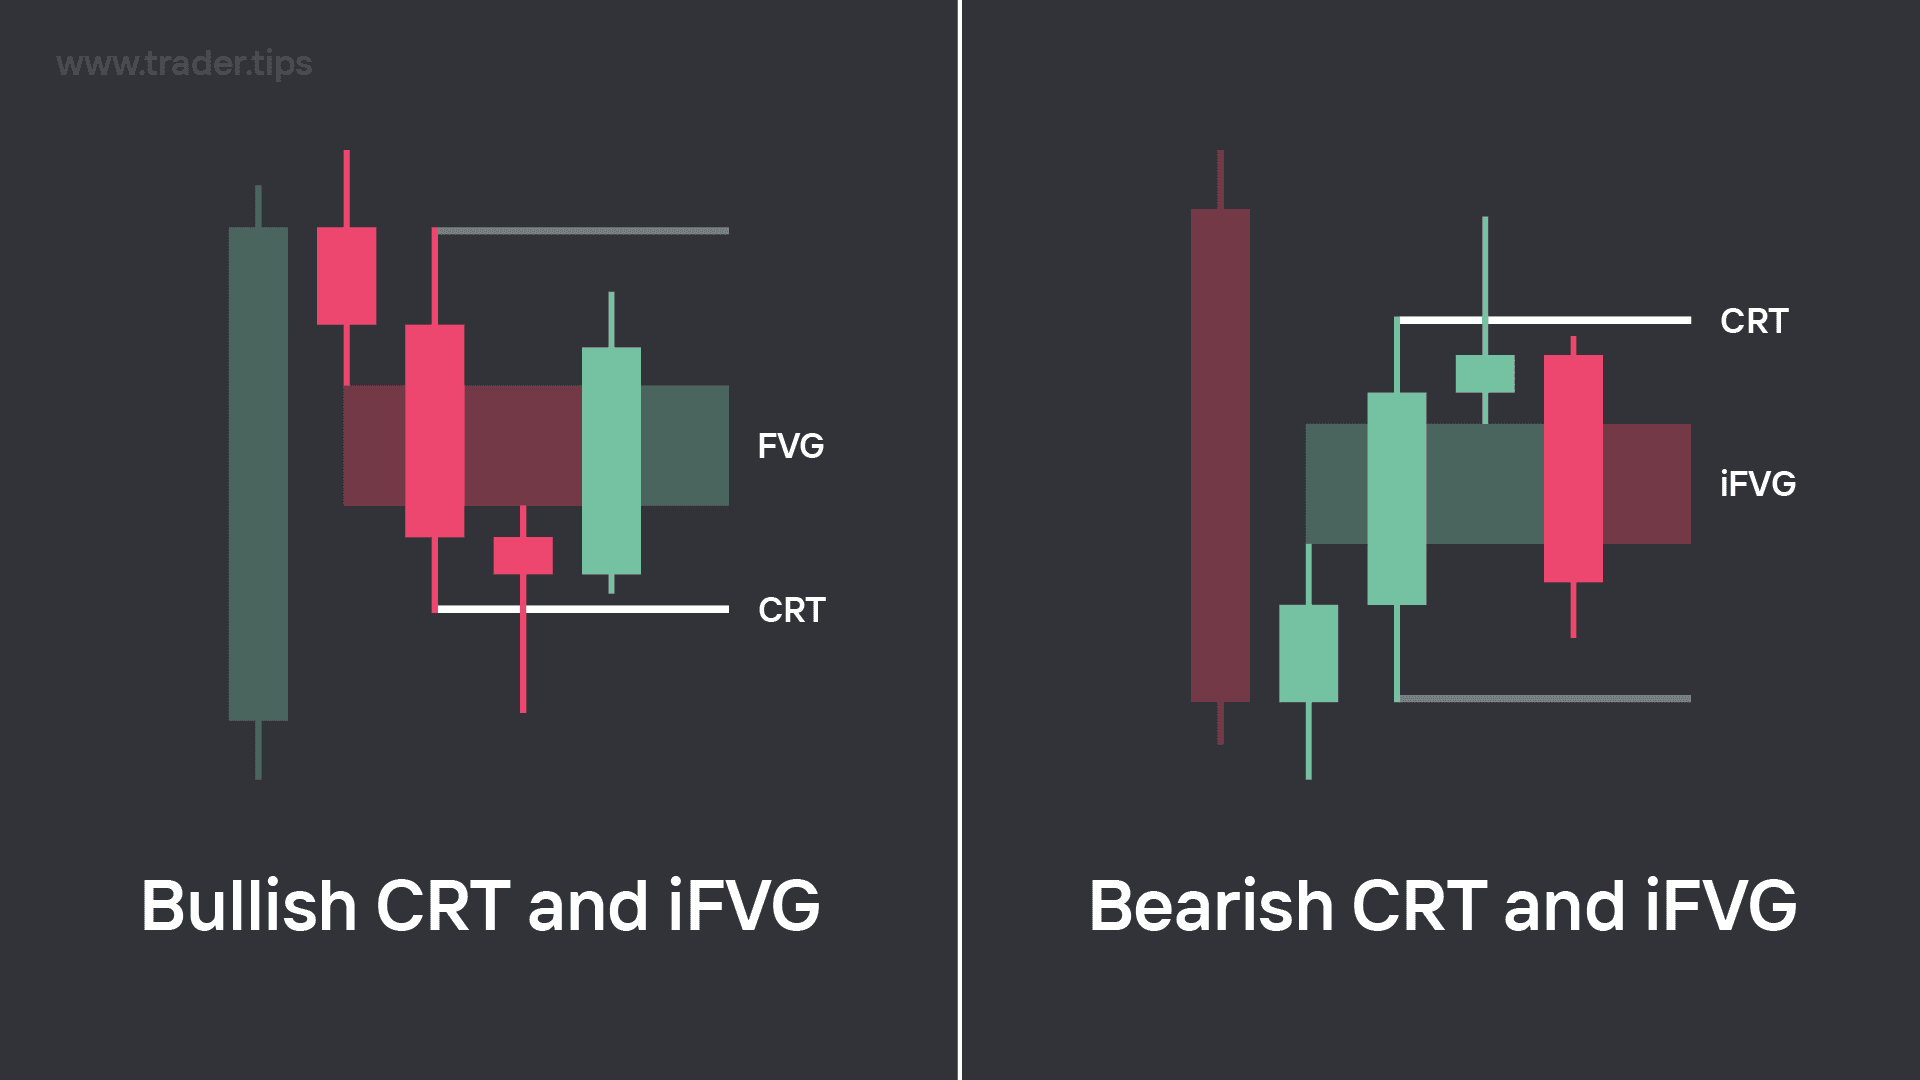
Examples of Bullish and Bearish CRT formations with iFVG confluences.
If price pushes through and closes past the Fair Value Gap, this creates a new PD Array, which is an Inversion Fair Value Gap (iFVG).
An invalidated Bearish FVG becomes a Bullish iFVG, which is a Bullish PD Array.
This would mean for the Bullish CRT formation, we would now have 2 Bullish confluences that support for our Bullish Bias, instead of having a conflicting Bias.
The creation of a Bullish iFVG after the Bullish CRT formation is what can offer us a potential long setup to trade.
An invalidated Bullish FVG becomes a Bearish iFVG, which is a Bearish PD Array.
This would mean for the Bearish CRT formation, we would now have 2 Bearish confluences that support for our Bearish Bias, instead of having a conflicting Bias.
The creation of a Bearish iFVG after the Bearish CRT formation is what can offer us a potential short setup to trade.
The Most Important Rule for Validating CRT Swing Formations
When it comes to validating a CRT swing formation, they should only be considered valid if they are created whilst interacting with a PD Array.
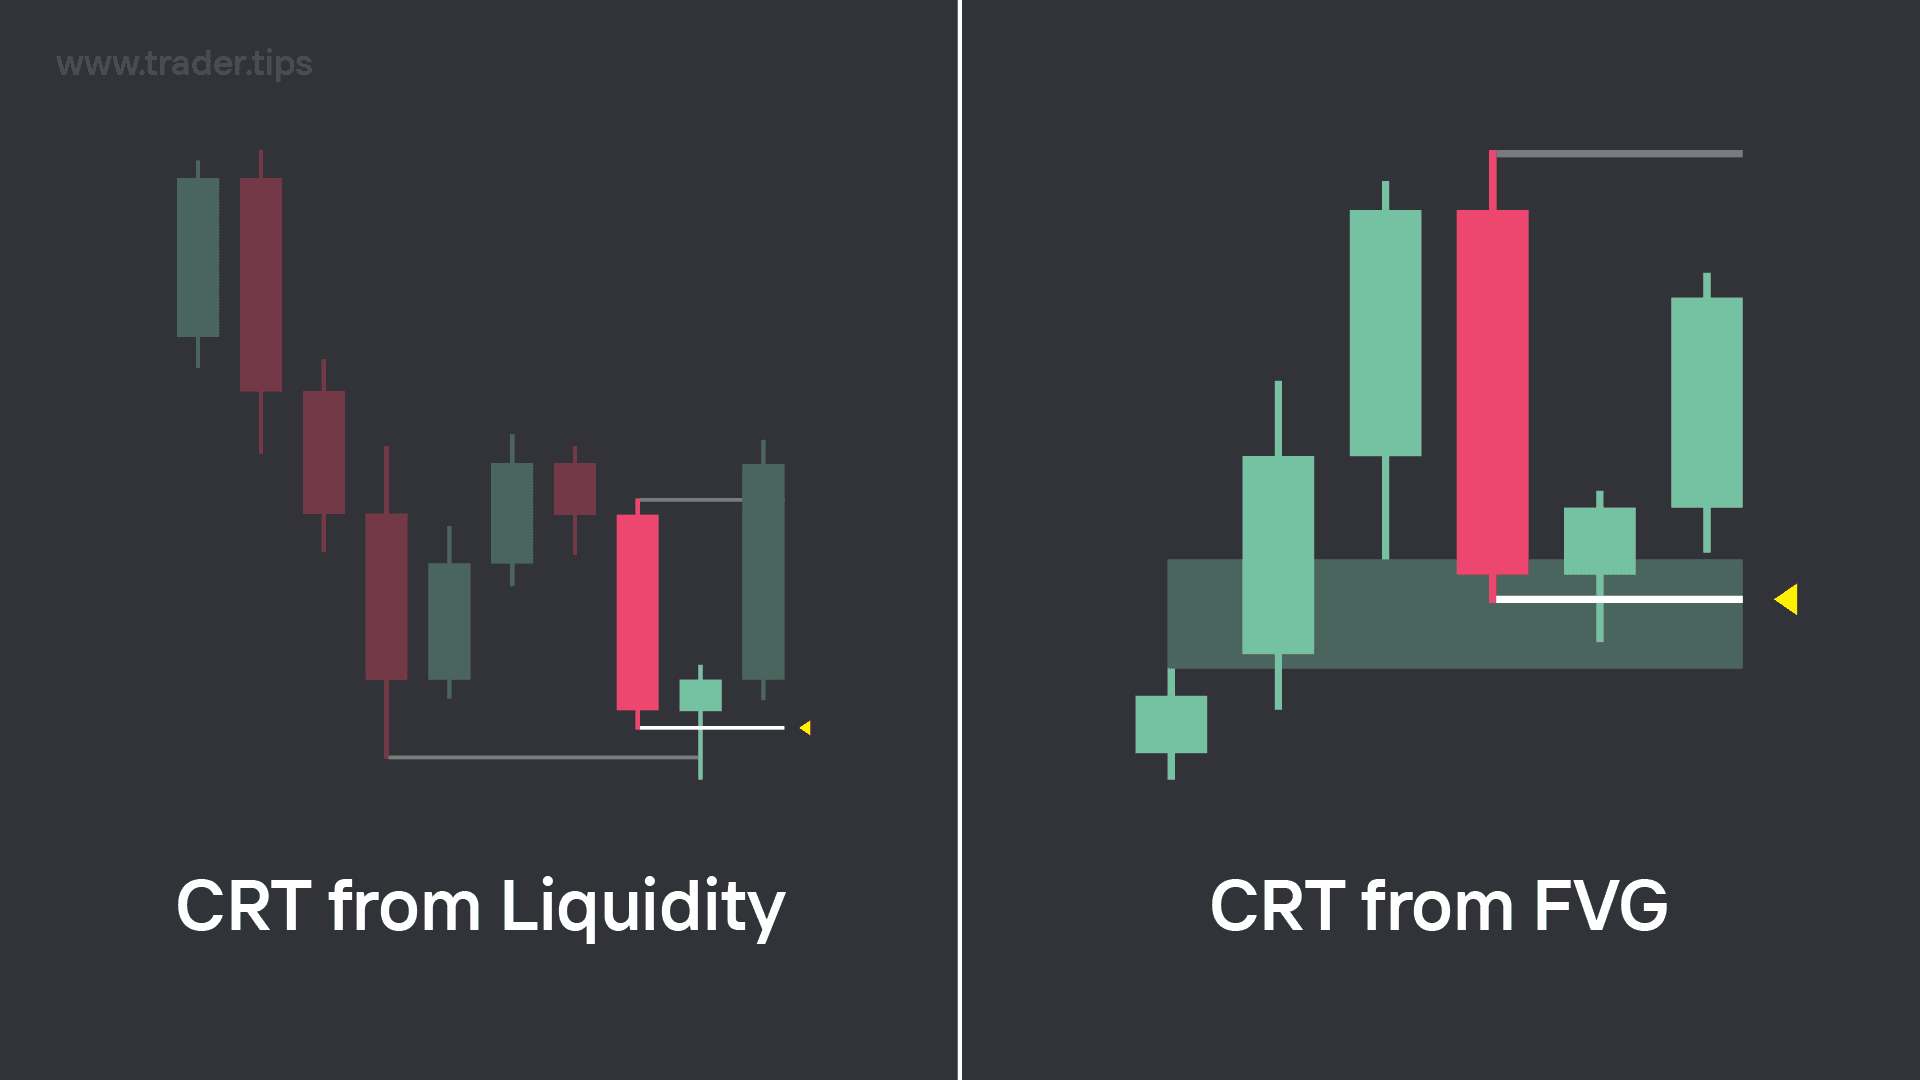
Examples of CRT formations from a Liquidity Sweep and a Fair Value Gap.
For example, if a CRT swing formation is created after hitting an External Range Liquidity Level, or after mitigating a Fair Value Gap, we can validate the CRT swing formation setup idea because these would be scenarios that we might expect a new swing point to form from.
But if a CRT swing formation is created randomly on the chart in the middle of a range, with no interaction with any PD Array that could support the idea of a new swing point forming, we would simply ignore these CRT candle formations because there is no confluence to support the setup idea.
Final Notes on CRT Candles
CRT Candles are used as a way to try and predict when a new Swing High or Swing Low is forming.
Unless they are formed whilst interacting with a PD Array that could potentially create a reversal move (Swing High or Swing Low), we simply ignore it as a valid CRT formation.
We don't blindly trade the following candles after a CRT Candle has formed, we always look at the lower timeframe market structure to look for a CISD that confirms the idea of a reversal move.
CRT Candles are essentially just a way to identify lower timeframe reversal market structure reversals whilst viewing a higher timeframe chart.