
Timeframes
A Timeframe refers to the length of time that each candlestick represents on a candlestick chart.
How Do Timeframes in Trading Work?
We use different timeframes to visualise how the market is moving over different quantities of time.
For example, when looking at a chart on the 5 minute timeframe, each individual candle will visualise how the price moved over a period of 5 minute.
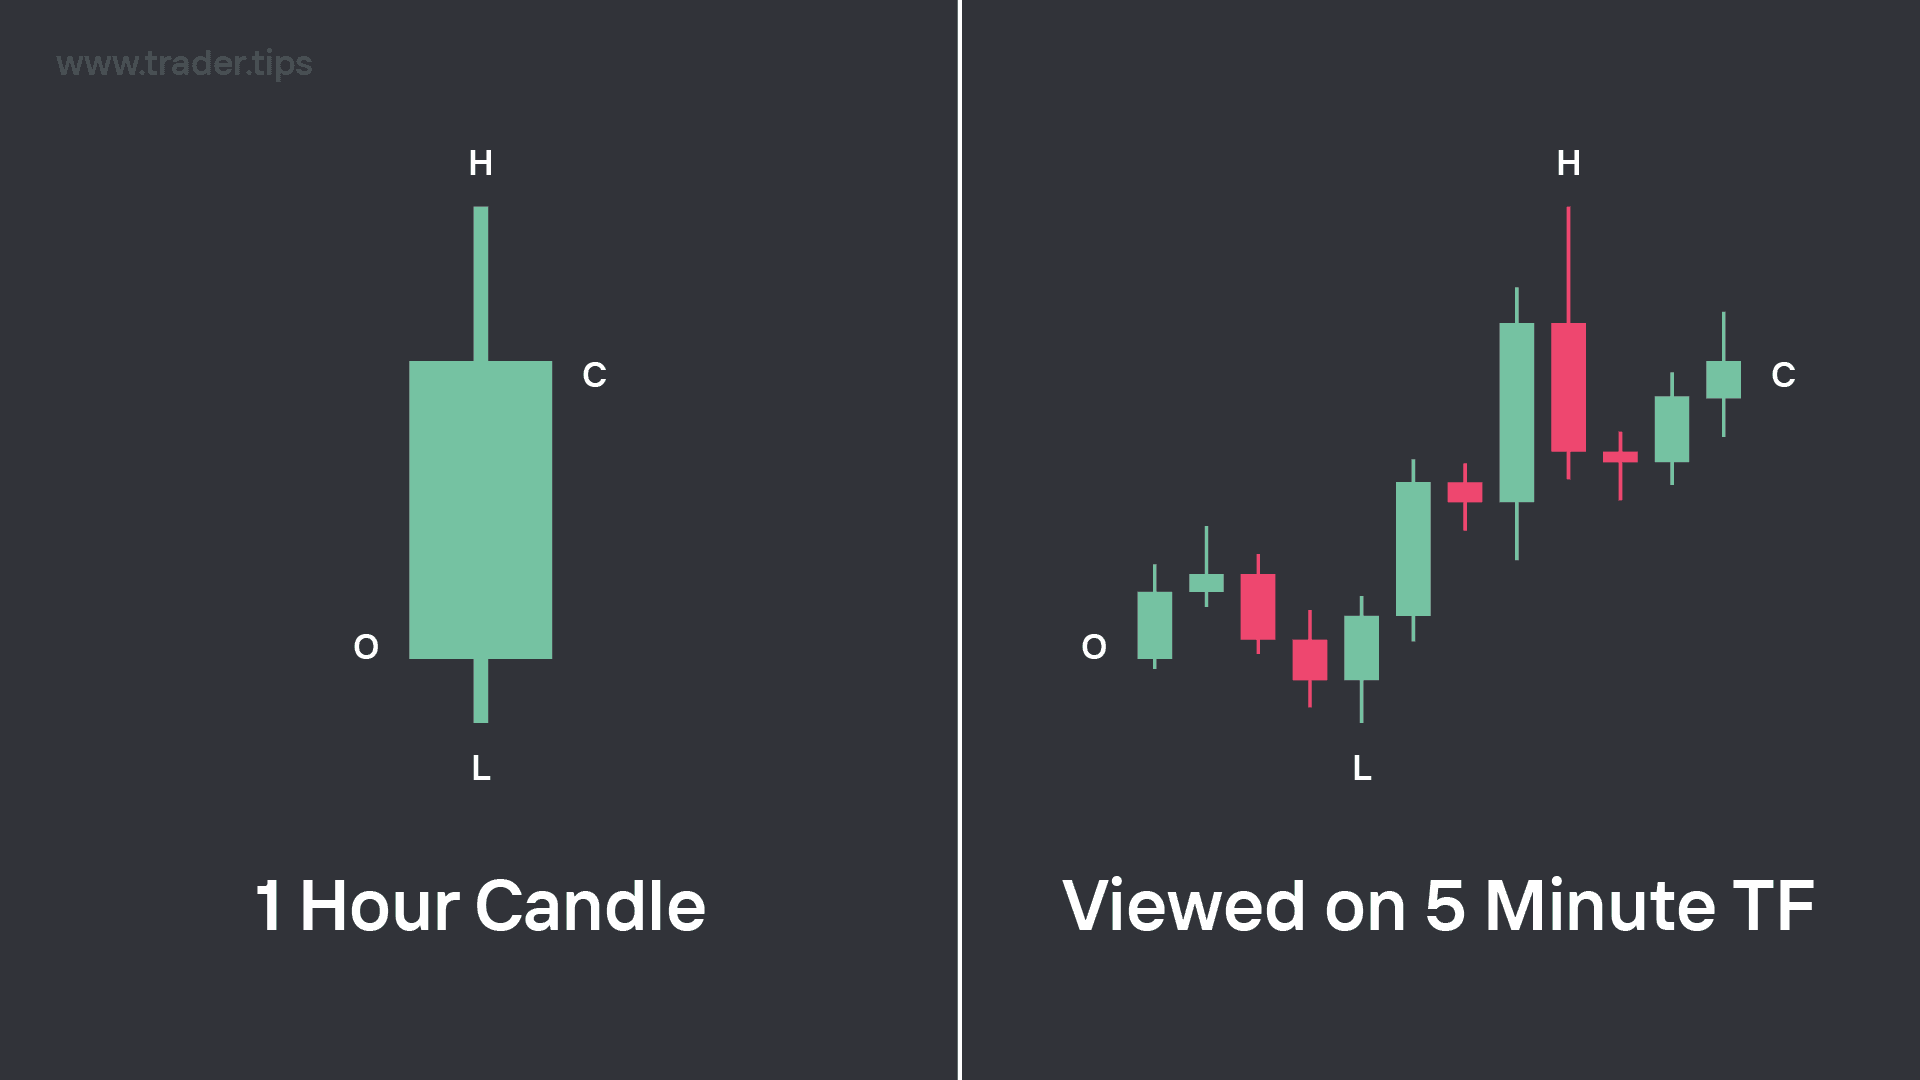
1 Hour bullish candlestick on the left. On the right, we see that 1 hour candle through the lens of viewing it with the 5 minute timeframe chart.
Here on the left, we have a 1 hour candle that was taken from a 1 hour timeframe chart. This means that this single candle reflects how the market moved over a period of 1 hour in time.
By using the 4 data points of OHLC that we covered in the candlesticks chapter, we know the Open Price (O), the High Price (H), the Low price (L), and the Close Price (C) for the price action within this 1 hour span of time.
But if we want to know more about how the market moved in order for this 1 hour candle's OHLC to form in this way, we can move down to a lower timeframe, like the 5 minute timeframe, to get a more detailed visualisation of how and when the market moved during that 1 hour period.
By viewing the this 1 hour candle through the lens of the 5 minute timeframe, it helps us to understand why the 1 hour candle formed the way that it did, whilst also exposing any interesting market structure movements that might otherwise be hidden on the higher 1 hour timeframe.
What timeframes should I use for trading?
Technically, you should be analysing all of the timeframes that are above the timeframe you use for entering your trades. We will cover more on this in a moment.
But as for the timeframes that are most commonly used by traders:
Monthly Timeframe (1M)
Weekly Timeframe (1W)
Daily Timeframe (1D)
4 Hour Timeframe (4H)
1 Hour Timeframe (1H)
15 Minute Timeframe (15m)
5 Minute Timeframe (5m)
1 Minute Timeframe (1m)
Some traders include other timeframes like the 6 Hour Timeframe (6H) or the 30 Minute Timeframe (30m), but for the most part, the timeframes above are the 'norm' for most traders.
Why do we use different timeframes?
The market moves the same across all timeframes, it is only displayed differently to allow us to easily zoom in to analyse the micro market moves, or zoom out to analyse the macro market moves.
Most traders use specific timeframes for finding trade setups, and then using smaller timeframes for executing their trade entries more precisely.
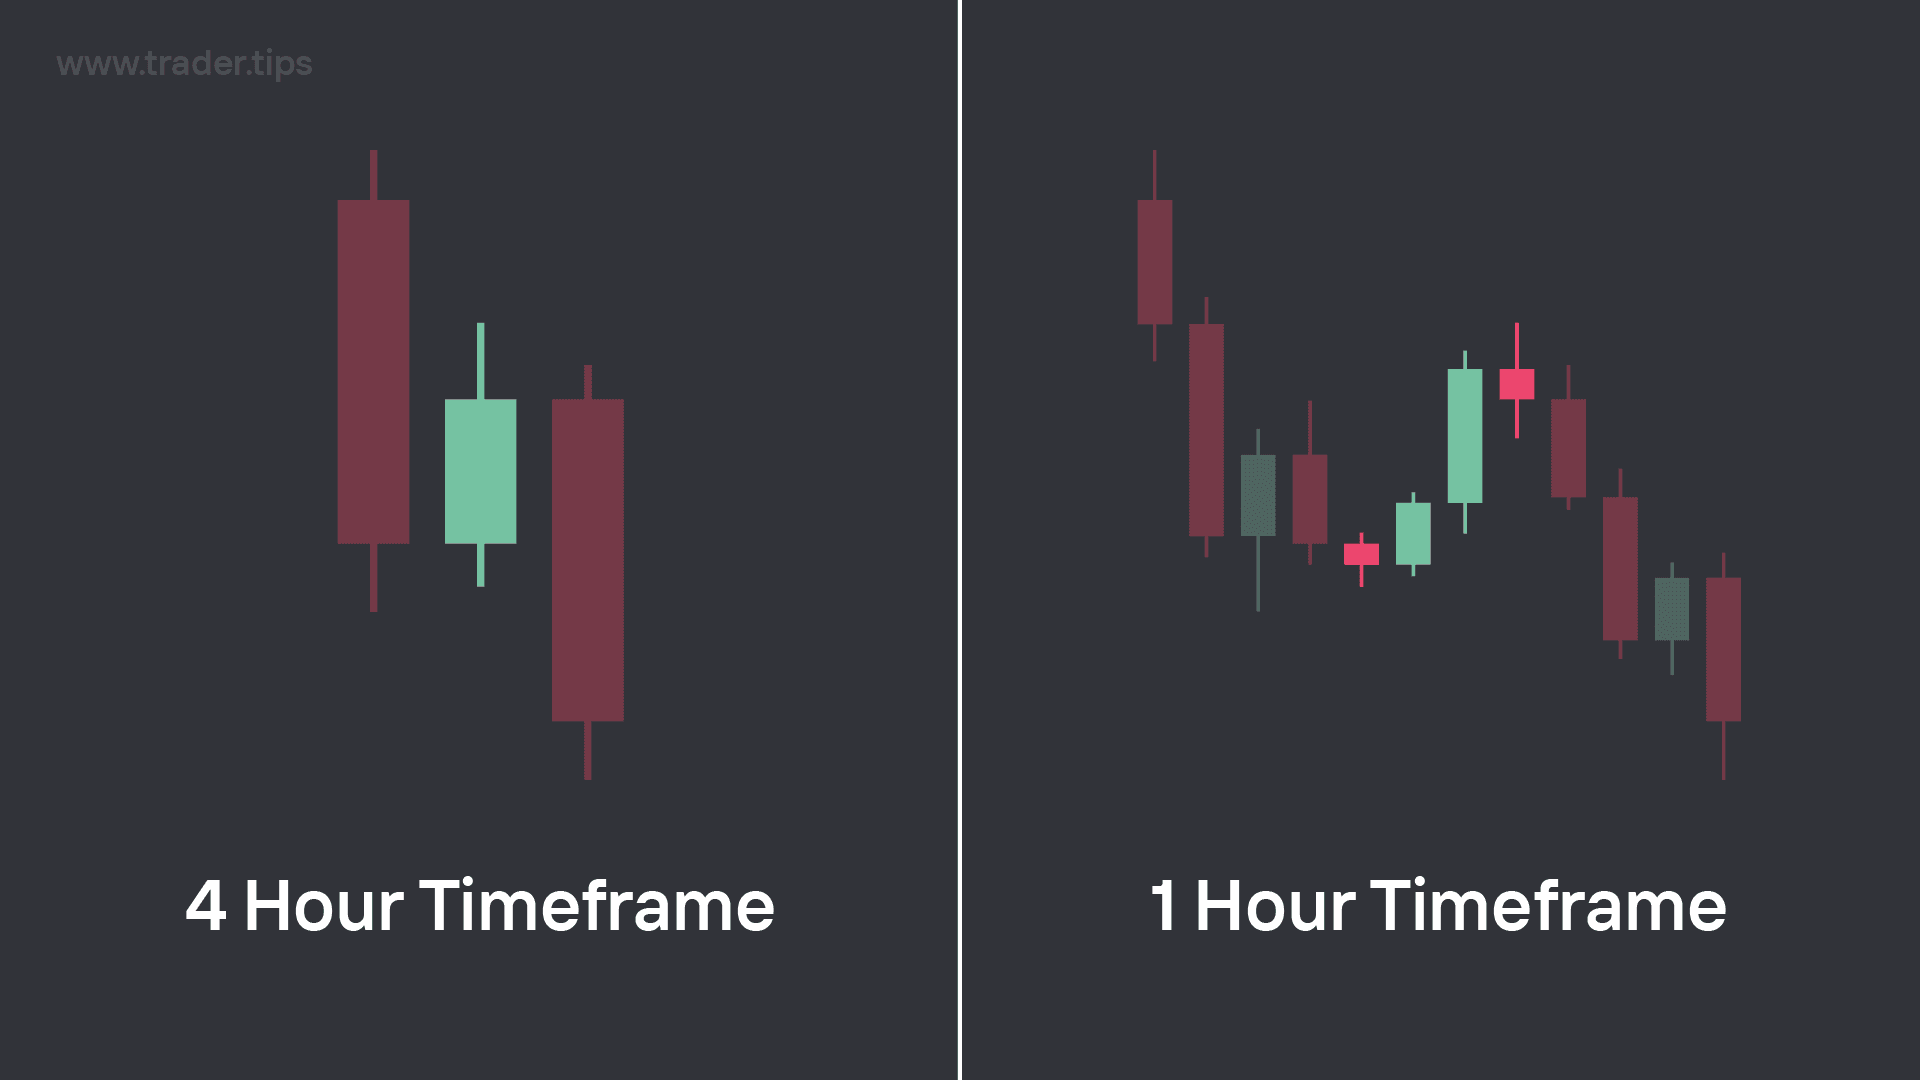
4 Hour candlesticks on the left. On the right, we see the same 4 hour candles through the lens of the 1 hour timeframe.
The market creates high timeframe levels and structures that can play out over days, weeks or months. But the market is also fractal, which means it will also create intraday levels and structures that can cause shorter term moves that might only last for minutes or hours.
This is why different traders use different timeframes depending on what style of trader they are.
Different Types of Traders:
Swing Trader:
Typically target long-term trades that can span days, weeks, or even months.
Day Trader:
Typically target intermediate-term trades that can last minutes, hours, or days.
Scalper:
Typically target short-term traders that only last seconds or minutes.
A swing trader would tend to target much larger moves, so they usually only care for the higher timeframes such as the daily, weekly and monthly timeframes.
Whereas for day traders or scalpers, they are looking for smaller but more frequent trades, so they would be looking to trade levels and structures that occur on the smaller timeframes, like the 1 minute, 5 minute, 15 minute, 1 hour, 4 hour and daily timeframes.
Top Down Analysis
Whilst a day trader might prefer to enter and exit their trades on the lower timeframes like the 5 minute or 1 minute timeframes, the most common mistake new traders make is that they either don't understand, or straight up ignore the fundamental rules of timeframe hierarchy in trading.
When it comes to timeframes, the most important rule to remember is that "the higher the timeframe, the higher the magnet".
What is meant by this is that the higher timeframe will always take president over the timeframes that are beneath it when it comes to how the market moves and reacts.
This is where the issue for most traders is found. For example, they might find a setup on a 5 minute timeframe that looks very bullish, so they decide to enter a long trade. But to their surprise, the market actually decides to dump downwards instead, even though the 5 minute timeframe looked very bullish. Leaving the trader to think their analysis was wrong.
But in actuality, their analysis of the 5 minute chart might have been perfect, but what they weren't aware of is that the market had dumped as a reaction of a higher 4 hour timeframe level being hit.
So you can be right about the market structure of one timeframe, but without seeing the full picture, you don't actually know what is happening.
This is where the process of Top-Down Analysis comes in.
What is Top Down Analysis?
Top Down Analysis involves starting your analysis process from the very highest timeframe.
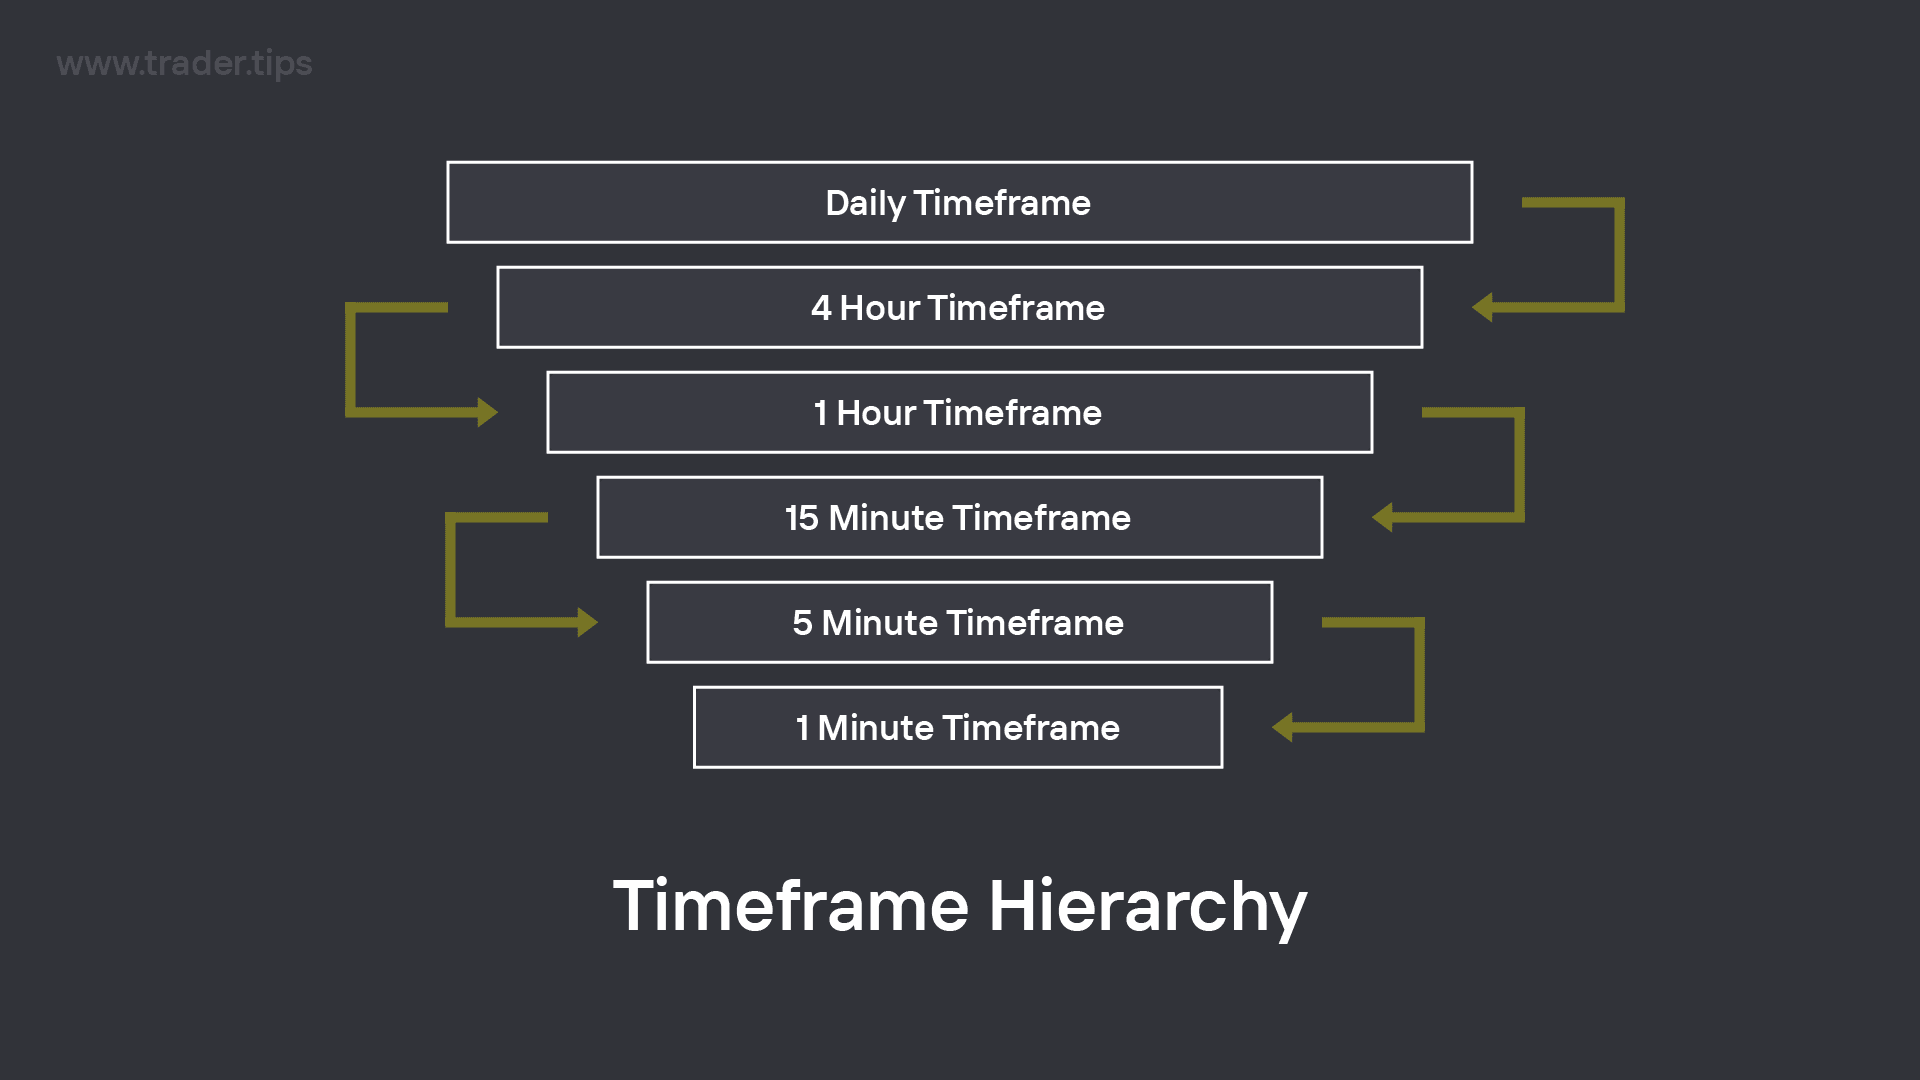
Visualisation of 'Timeframe Hierarchy'.
Once you have read and understood the market structure to find a general directional bias (whether you think it wants to go up or down) of that highest timeframe, you can then move down to the timeframe below it to repeat the exact same process again.
You'd do this all the way down in timeframes until you reach the timeframe you want to actually enter your trades from.
So for example, if you use the 15 minute timeframe for you trade entries, you would want to start your analysis on at least the daily timeframe chart, then moving down to the 4 hour timeframe, then the 1 hour timeframe, before finally reaching the 15 minute timeframe.
Why should you use Top Down Analysis?
By using Top Down Analysis, you give yourself a clear understanding of the bigger picture of how the market is moving, what levels it is creating or reacting from, but most importantly, where you think it will most likely move to next.
Without this awareness, you can easily find yourself becoming tunnel-visioned into a setup that is actually not very likely to play out the way you might expect.
We will be covering more on timeframes in the more advanced timeframe alignment chapter later on in the SMC course.
