
Ranges and Equilibrium
Ranges are where the buyers and sellers fight over price action dominance. The Equilibrium tells us where the middle of the range is.
What is a Range in trading?
A 'range' is an area that spans between a swing high and swing low. The market will move up and down within a range, until it breaks through either the high or low of the range, which will result in a new range being created.
Ranges are created all over a market's chart, on every timeframe.
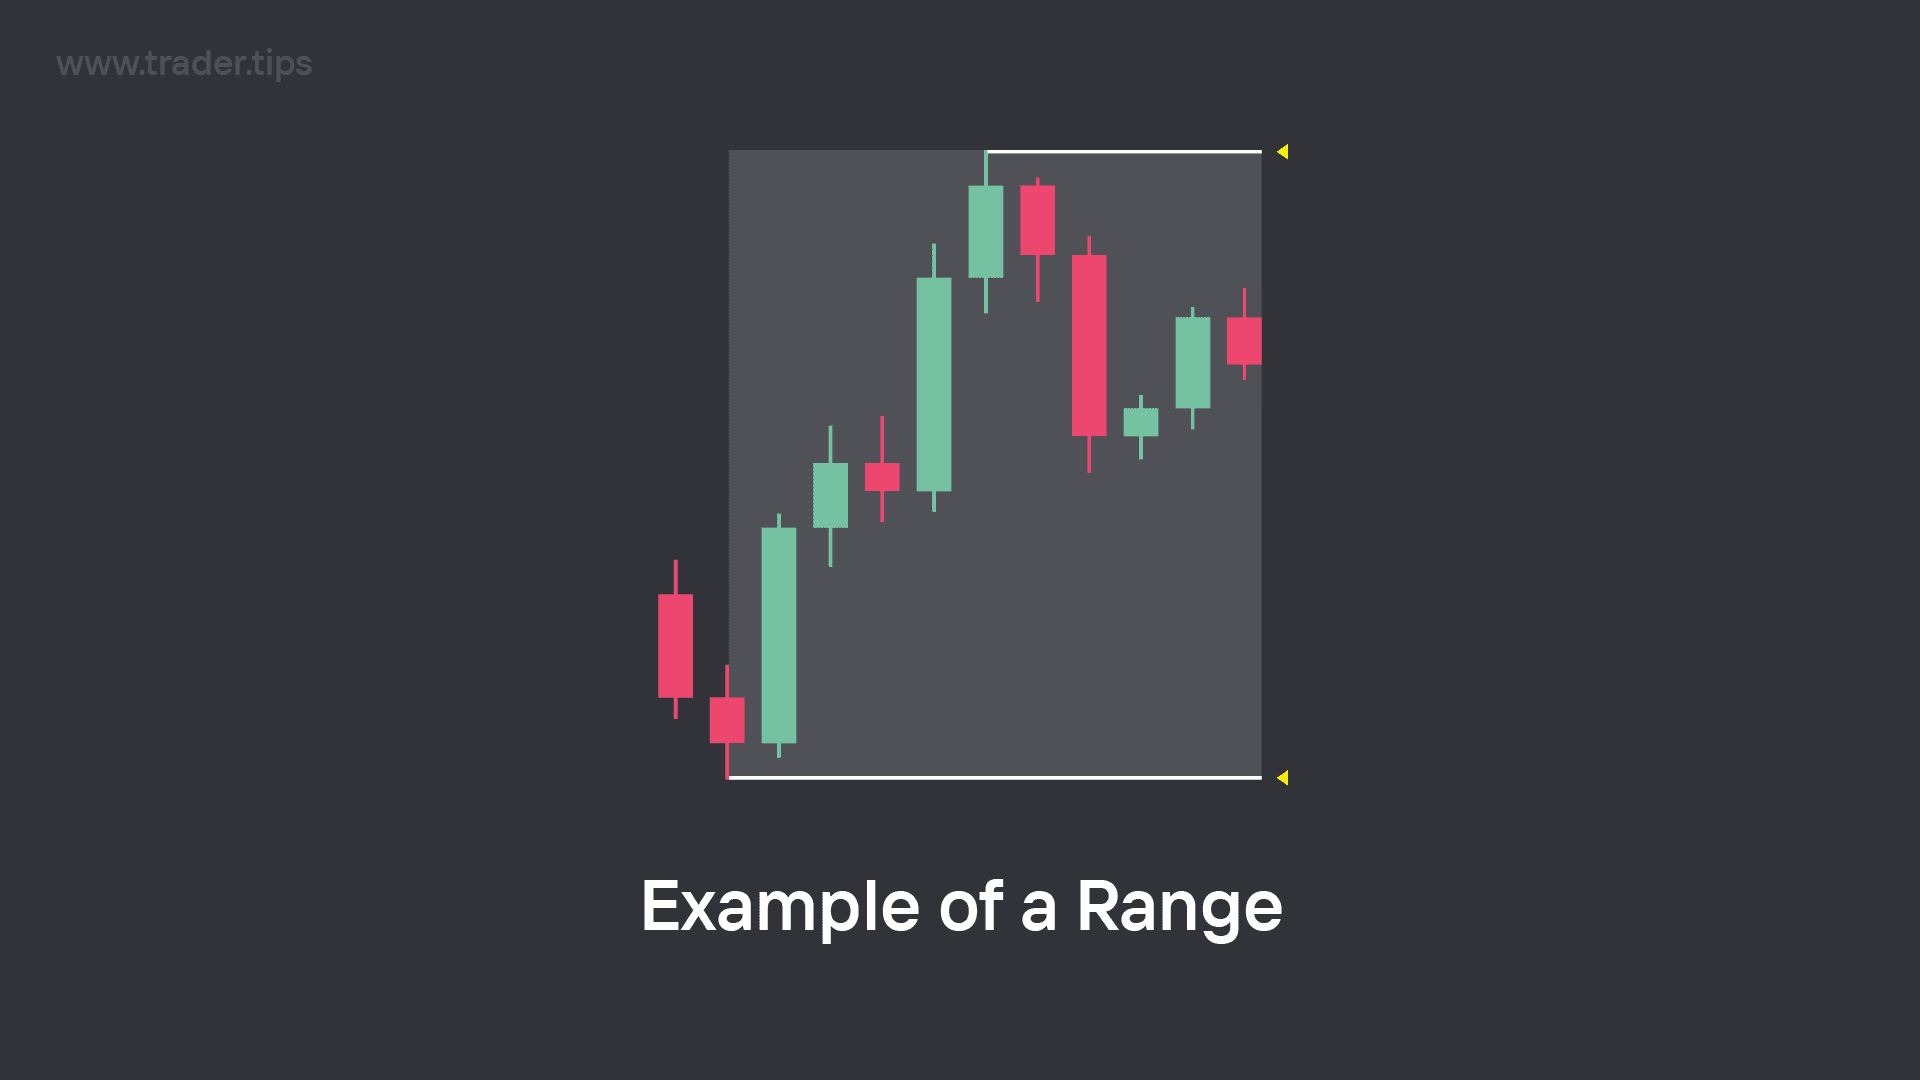
Example of a Range in trading.
We draw our ranges from an external swing to an external swing low.
The area within a range can be broken down into 3 parts:
Equilibrium Level
Premium Area
Discount Area
Equilibrium (EQ) Level of a Range
The Equilibrium (EQ) Level is drawn from the 50% midlevel of range area spanning between the swing high and swing low.
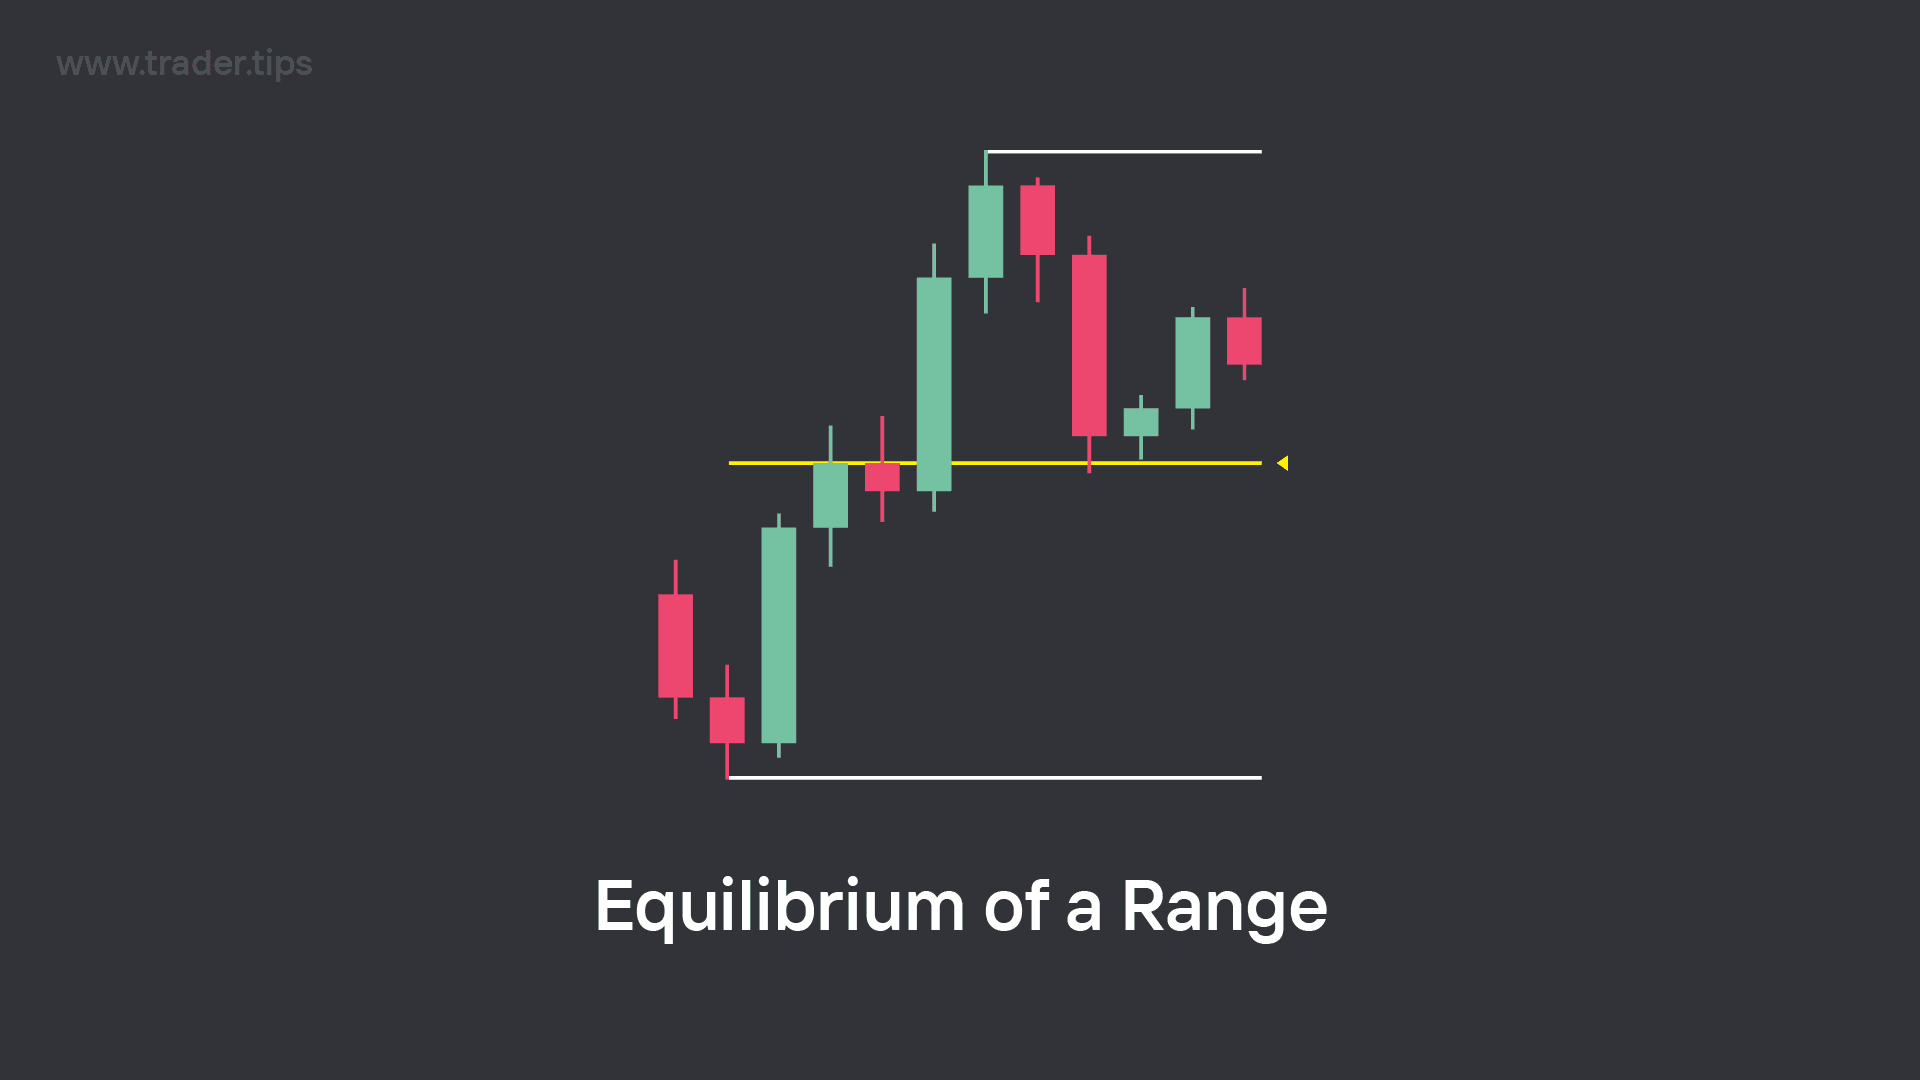
Equilibrium Level of a Range (50% Midlevel).
This level is very significant in how we determine the strength of a move in comparison the EQ of a range.
By itself, it can act as a catalyst for market reactions which we will cover further into the course.
Premium Area of a Range
The 'Premium Area' of a range is the area spanning from the swing high of the range, to the 50% EQ level of the range.
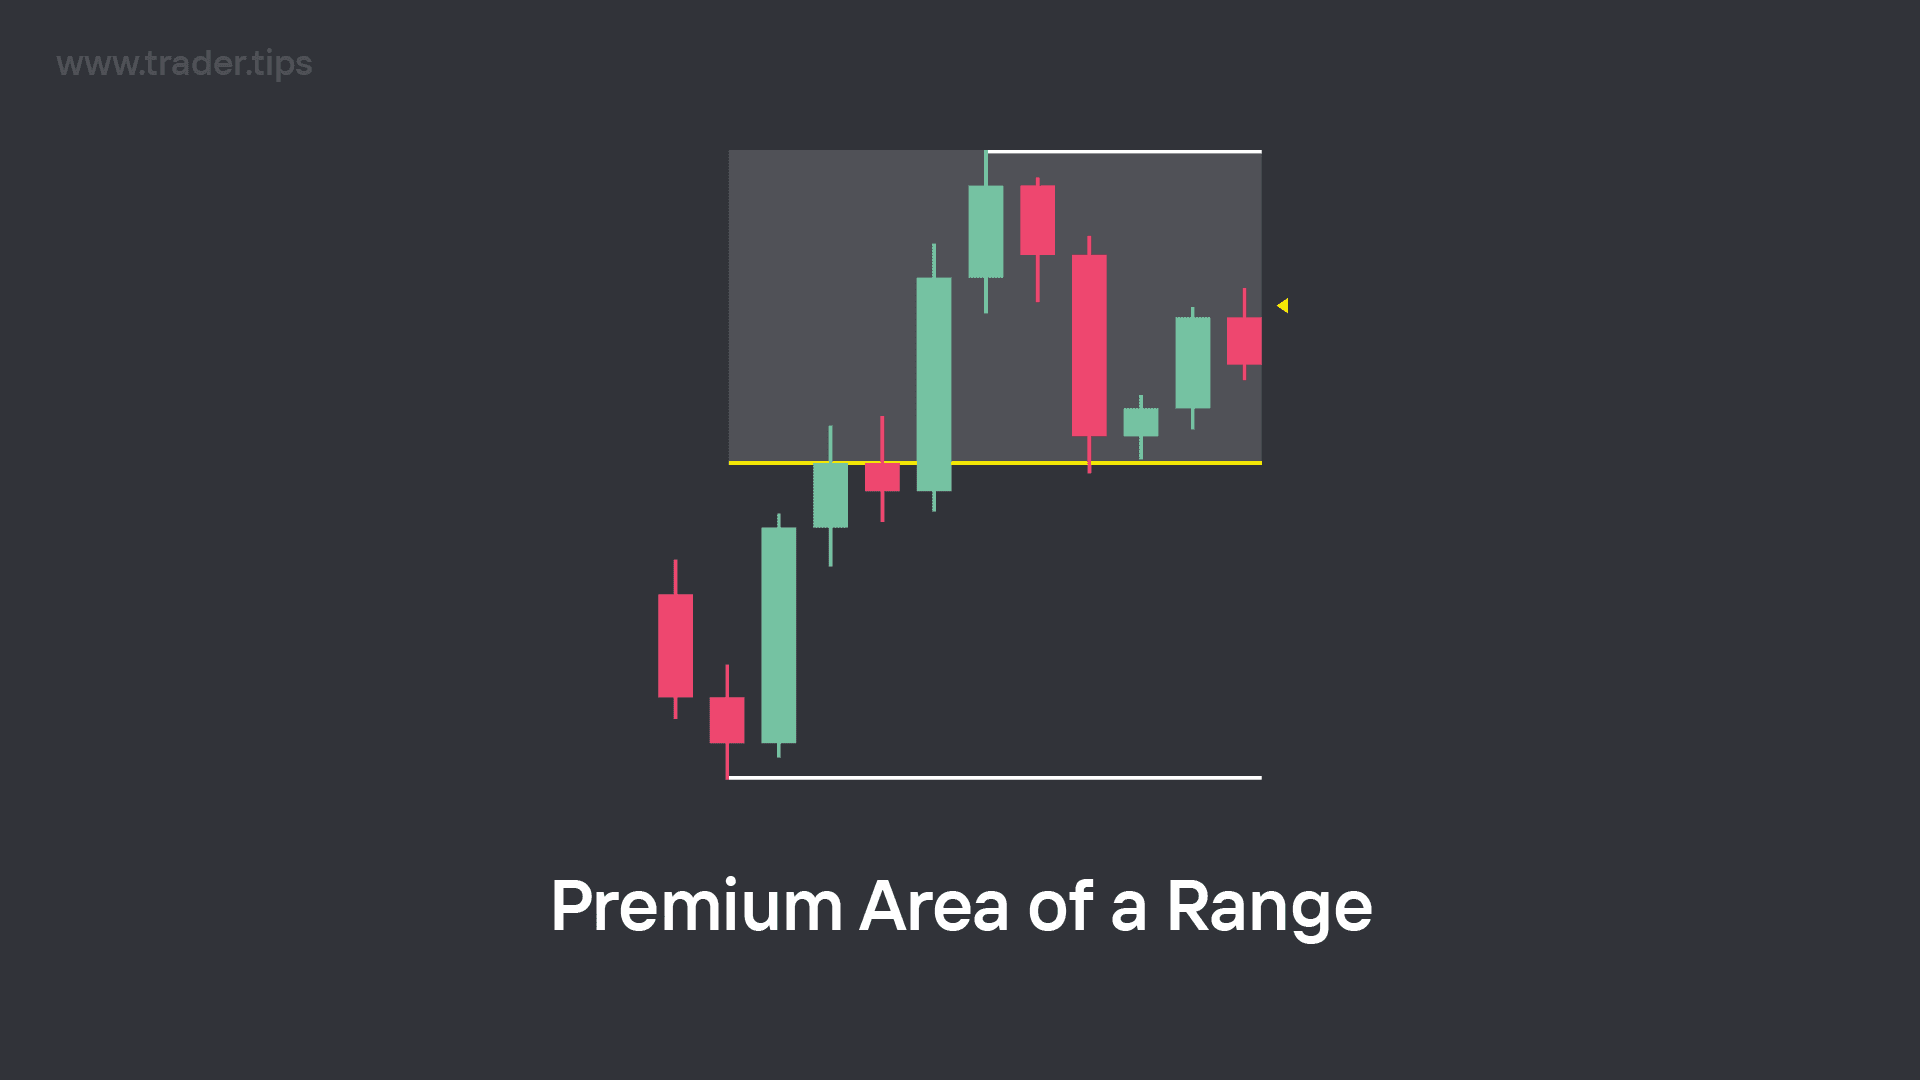
Premium Area of a Range.
The Premium Area is deemed the most optimal area of a range for entering short trades if we are looking for short setups, following a bearish directional bias.
This doesn't mean you should just short anywhere within the Premium Area of a range. It's used more as a measurement tool in finding higher risk-to-reward trade setups when it comes to shorting a range using the high to low as stop-loss and take-profit targets.
Shorting above the EQ would mean the risk-to-reward ratio would be over 1 if you were to use the low and high of the range as your take-profit and stop-loss levels.
Discount Area of a Range
The 'Discount Area' of a range is the area spanning from the swing low of the range, to the 50% EQ level of the range.
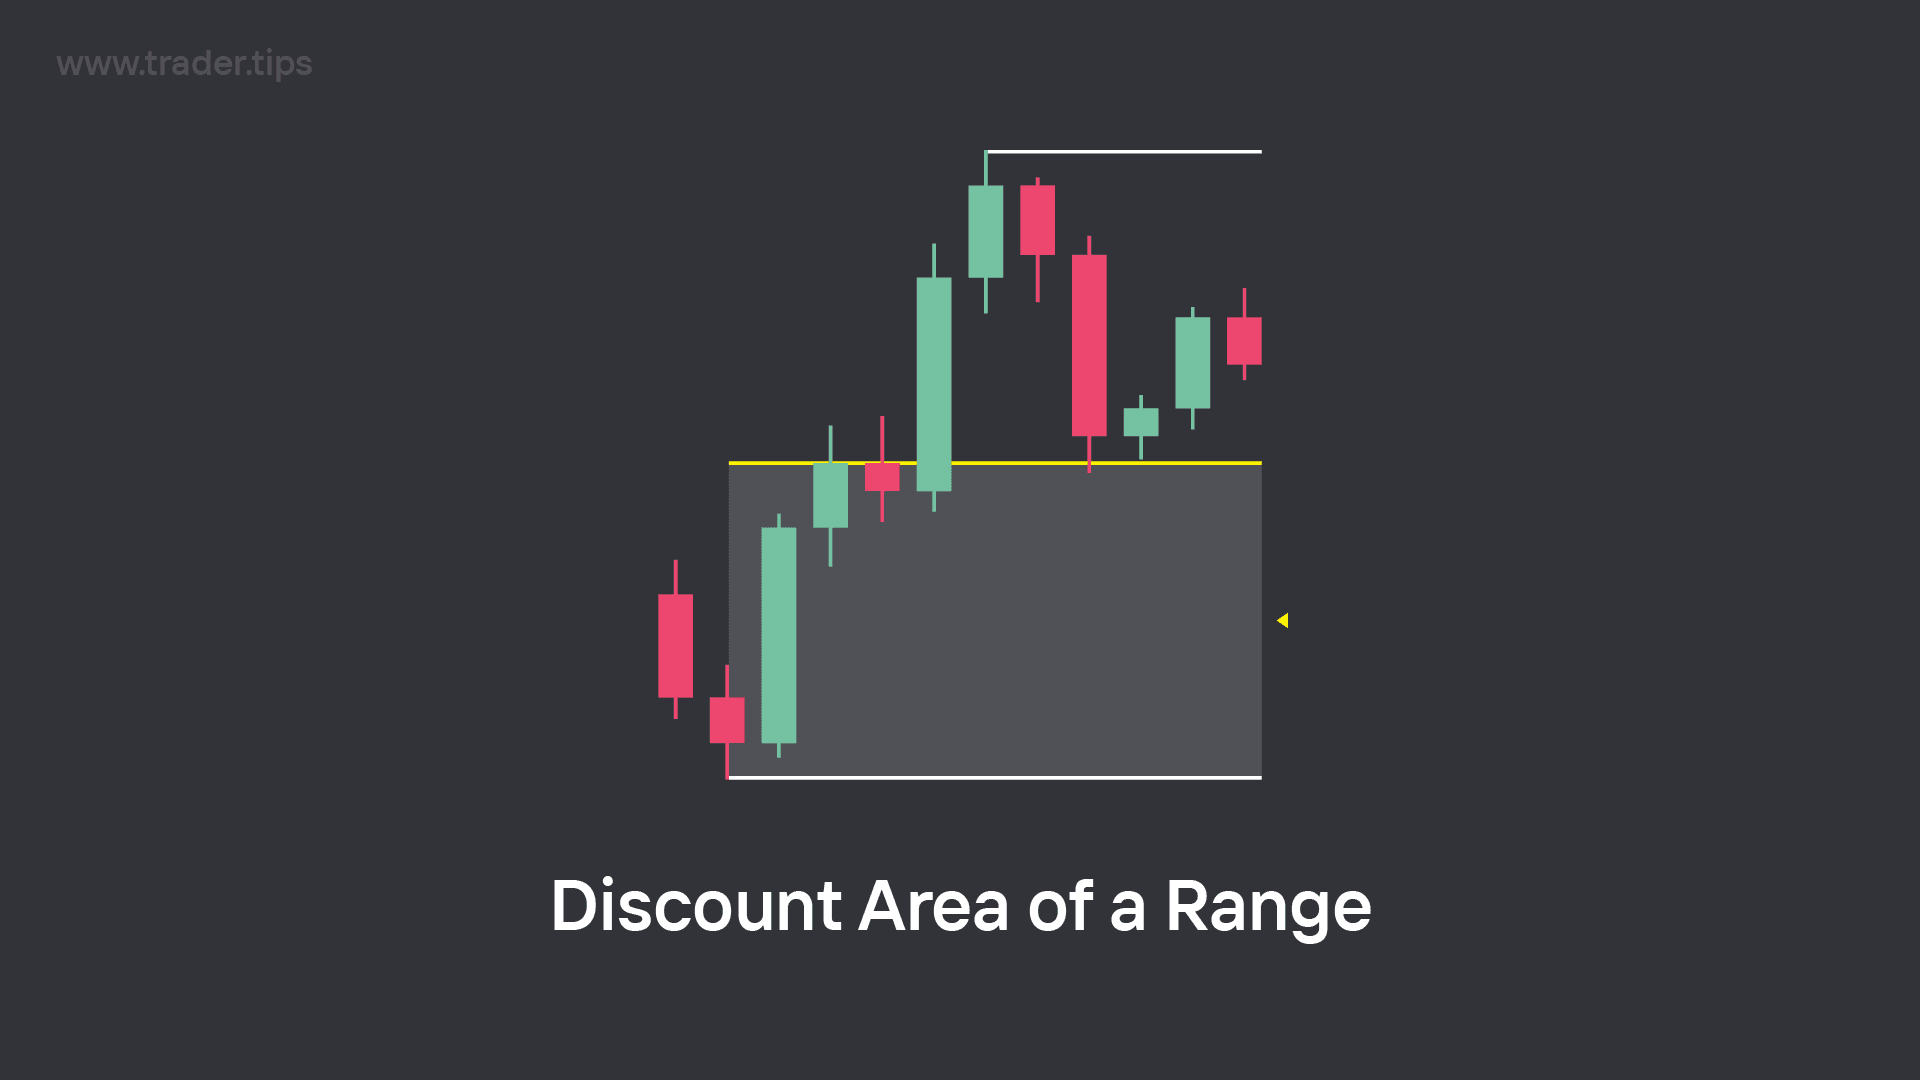
Discount Area of a Range.
The Discount Area is deemed the most optimal area of a range for entering long trades if we are looking for long setups, following a bullish directional bias.
This doesn't mean you should just long anywhere within the Discount Area of a range. It's used more as a measurement tool in finding higher risk-to-reward trade setups when it comes to longing a range using the low to high as stop-loss and take-profit targets.
Longing below the EQ would mean the risk-to-reward ratio would be over 1 if you were to use the high and low of the range as your take-profit and stop-loss levels.
Multiple Ranges
The market is constantly making ranges, and this includes making smaller ranges within larger ranges.
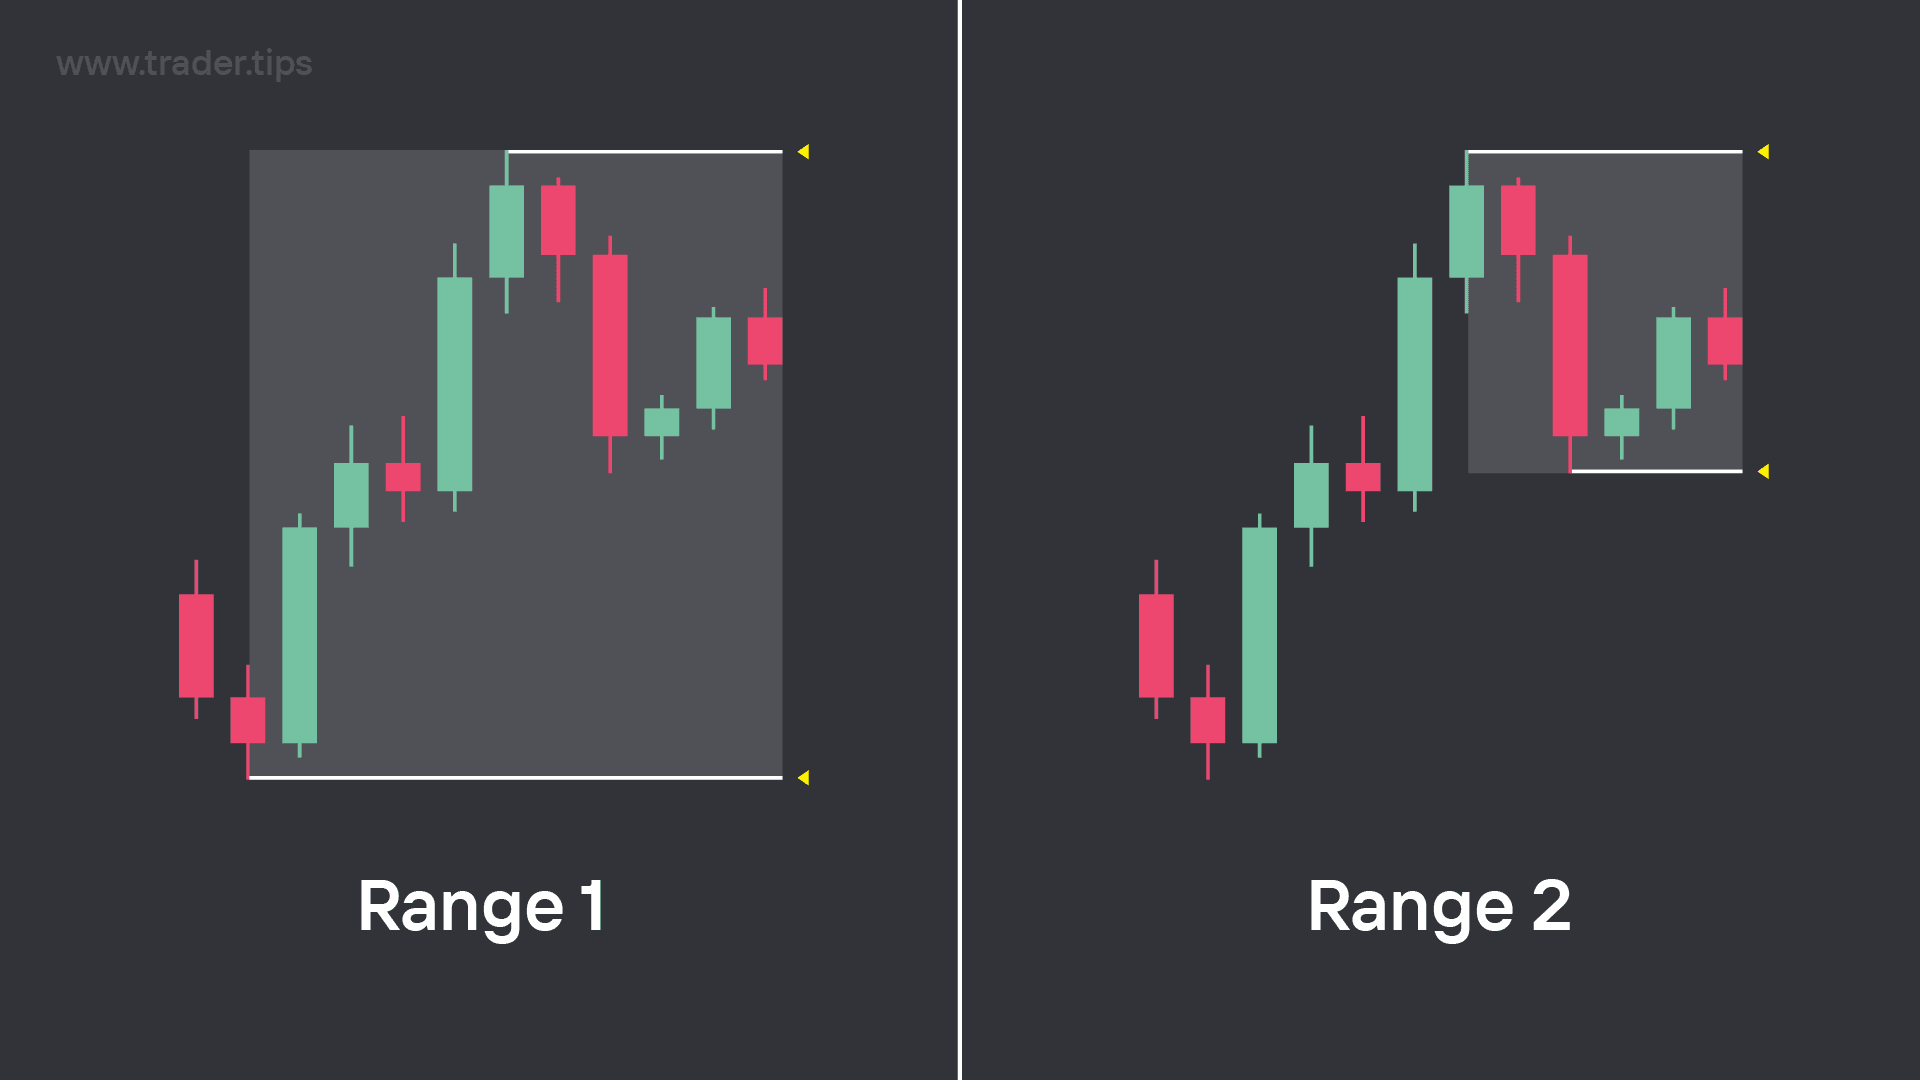
Example of how there can be multiple ranges within a chart's market structure.
With the fractal nature of a chart, each range will be forming expansion and reversal moves based on its own internal market structure within it. But at the same time, the way in which these smaller ranges form and play out will consequentially contribute to how the large moves are played out within the larger ranges.
In simple terms, this means that the smaller ranges/legs of a lower timeframe would just be a smaller expansion or retracement move within a larger timeframe's range.
But this is also why top-down analysis is so important, because as we mentioned before in the timeframes chapter, the higher timeframe market structure levels and moves always override any potential setups that are playing out on the lower timeframes.
We always want to align our trade setups with the bias of the higher timeframe structures.
Range of an Individual Candle
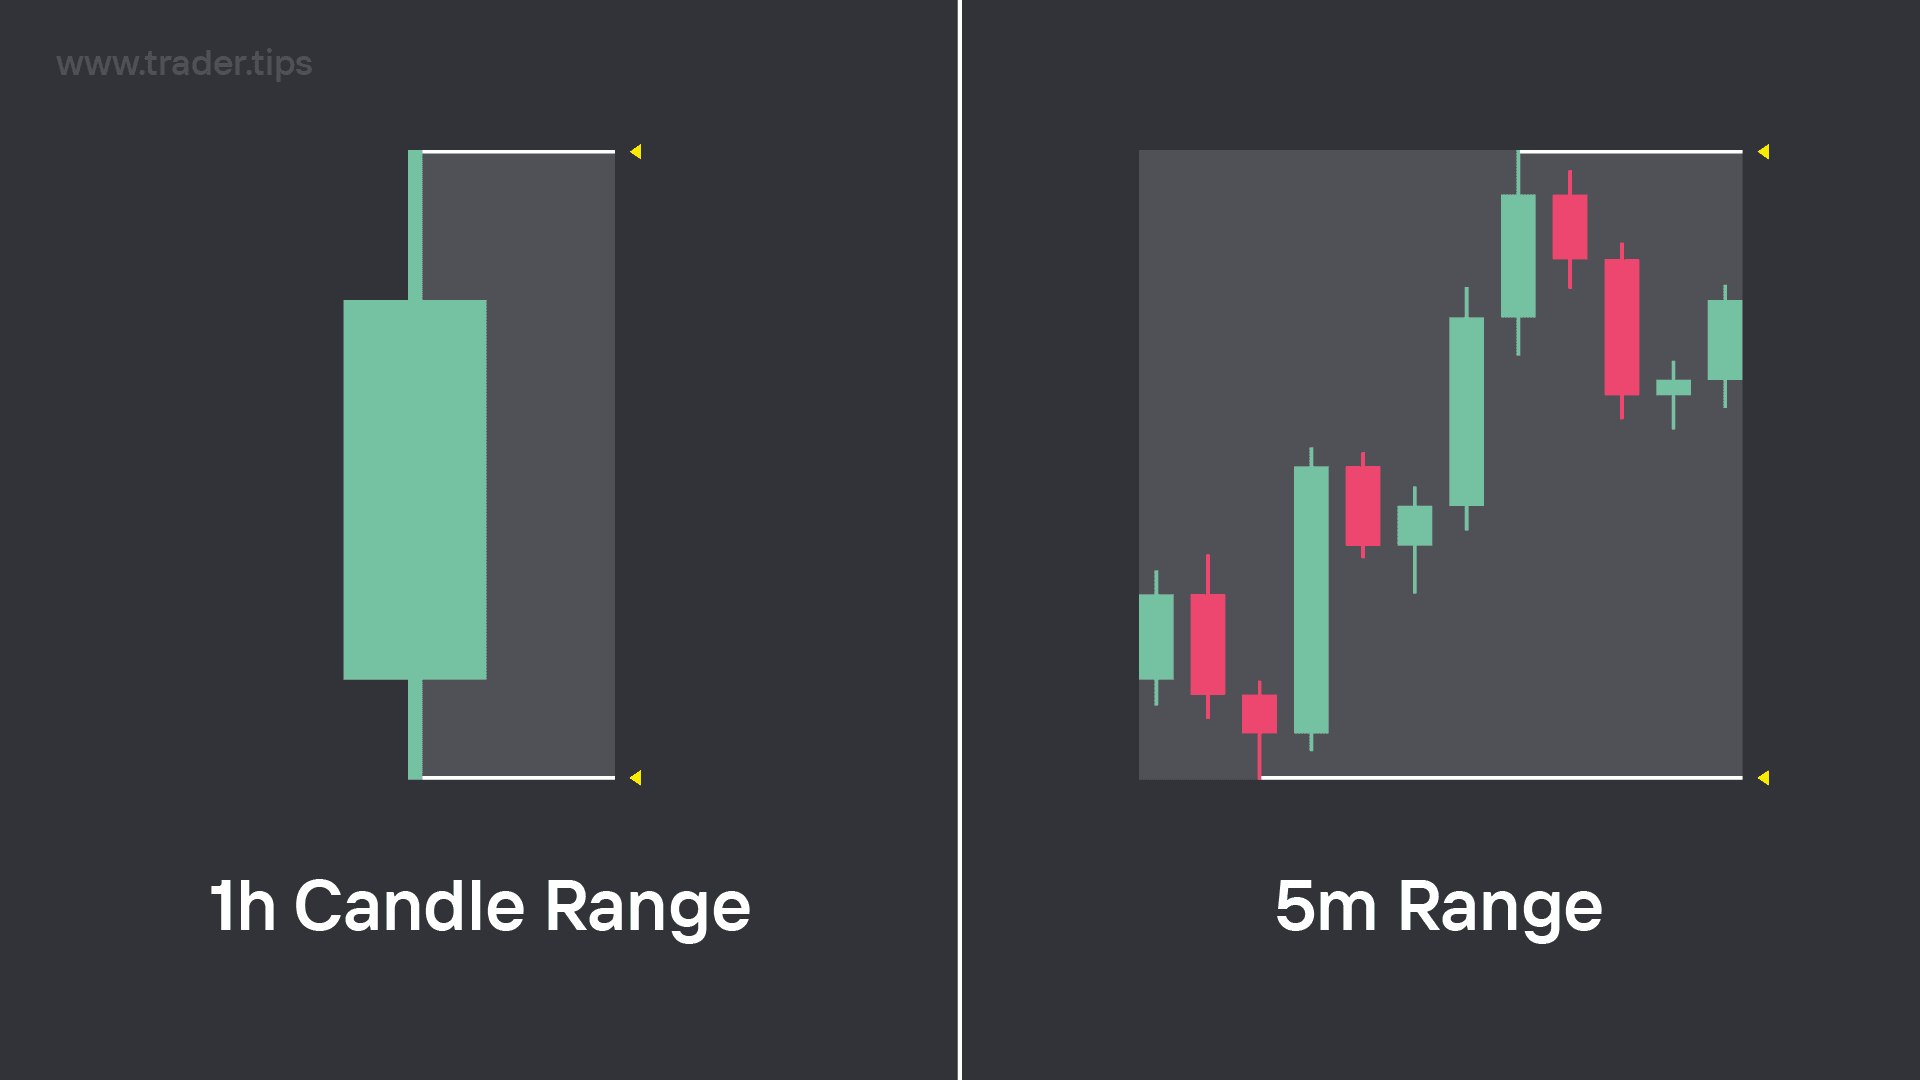
Example of a 1 Hour Candle's Range viewed through the lens of the 5 Minute Timeframe.
As we mentioned before, a range defines the area between a high and a low.
This means a range can also span just 1 singular candle.
This is because each candle holds it's own high and low. When you move down to a lower timeframe, this high and low becomes much clearer to visualise as they will be seen as swing highs and swing lows on the lower timeframes.
A great example of how a single candle is commonly used is with the previous daily candle's high and low being used as liquidity levels.
If you were to look at the previous daily candle on a 15 minute timeframe chart, there are 96 candles that make up the range of the previous daily candle.
When looking at a higher timeframe candle through the lens of a lower timeframe, the range between the high and low seems very obvious, but at the same time, it is still just the range of 1 singular candle from the higher timeframe.
Equilibrium of an Individual Candle
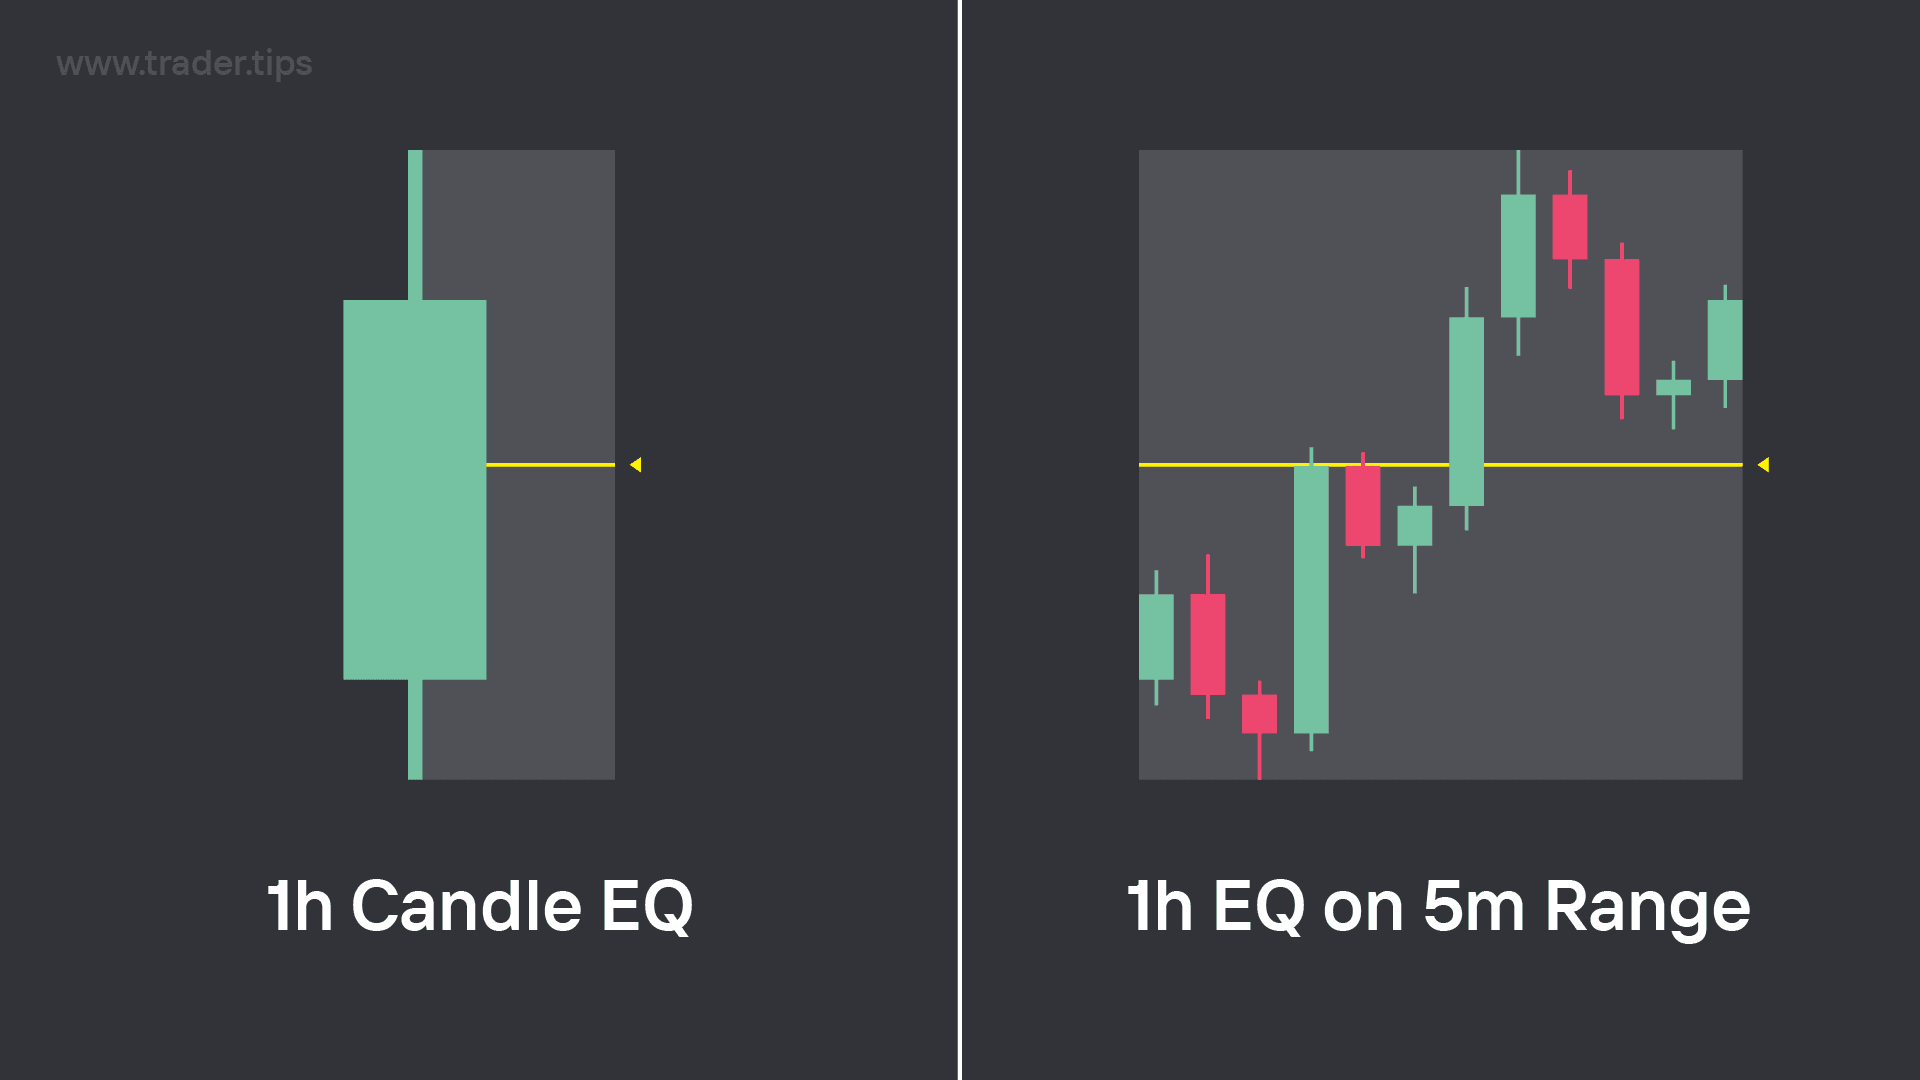
Example of a 1 Hour Candle's EQ viewed through the lens of the 5 Minute Timeframe.
With a single candle possessing it's own individual range, this also means that a single candle will also have it's own Equilibrium (EQ) Level.
This level becomes a very useful tool for when analysing how the next candle might form in relation to the previous candle, which we will cover more on in the Candle Closures chapter of the course.