Trading Education
Prop Firm Discounts
Discord
Learn the basic fundamentals of how to read a chart's market structure.
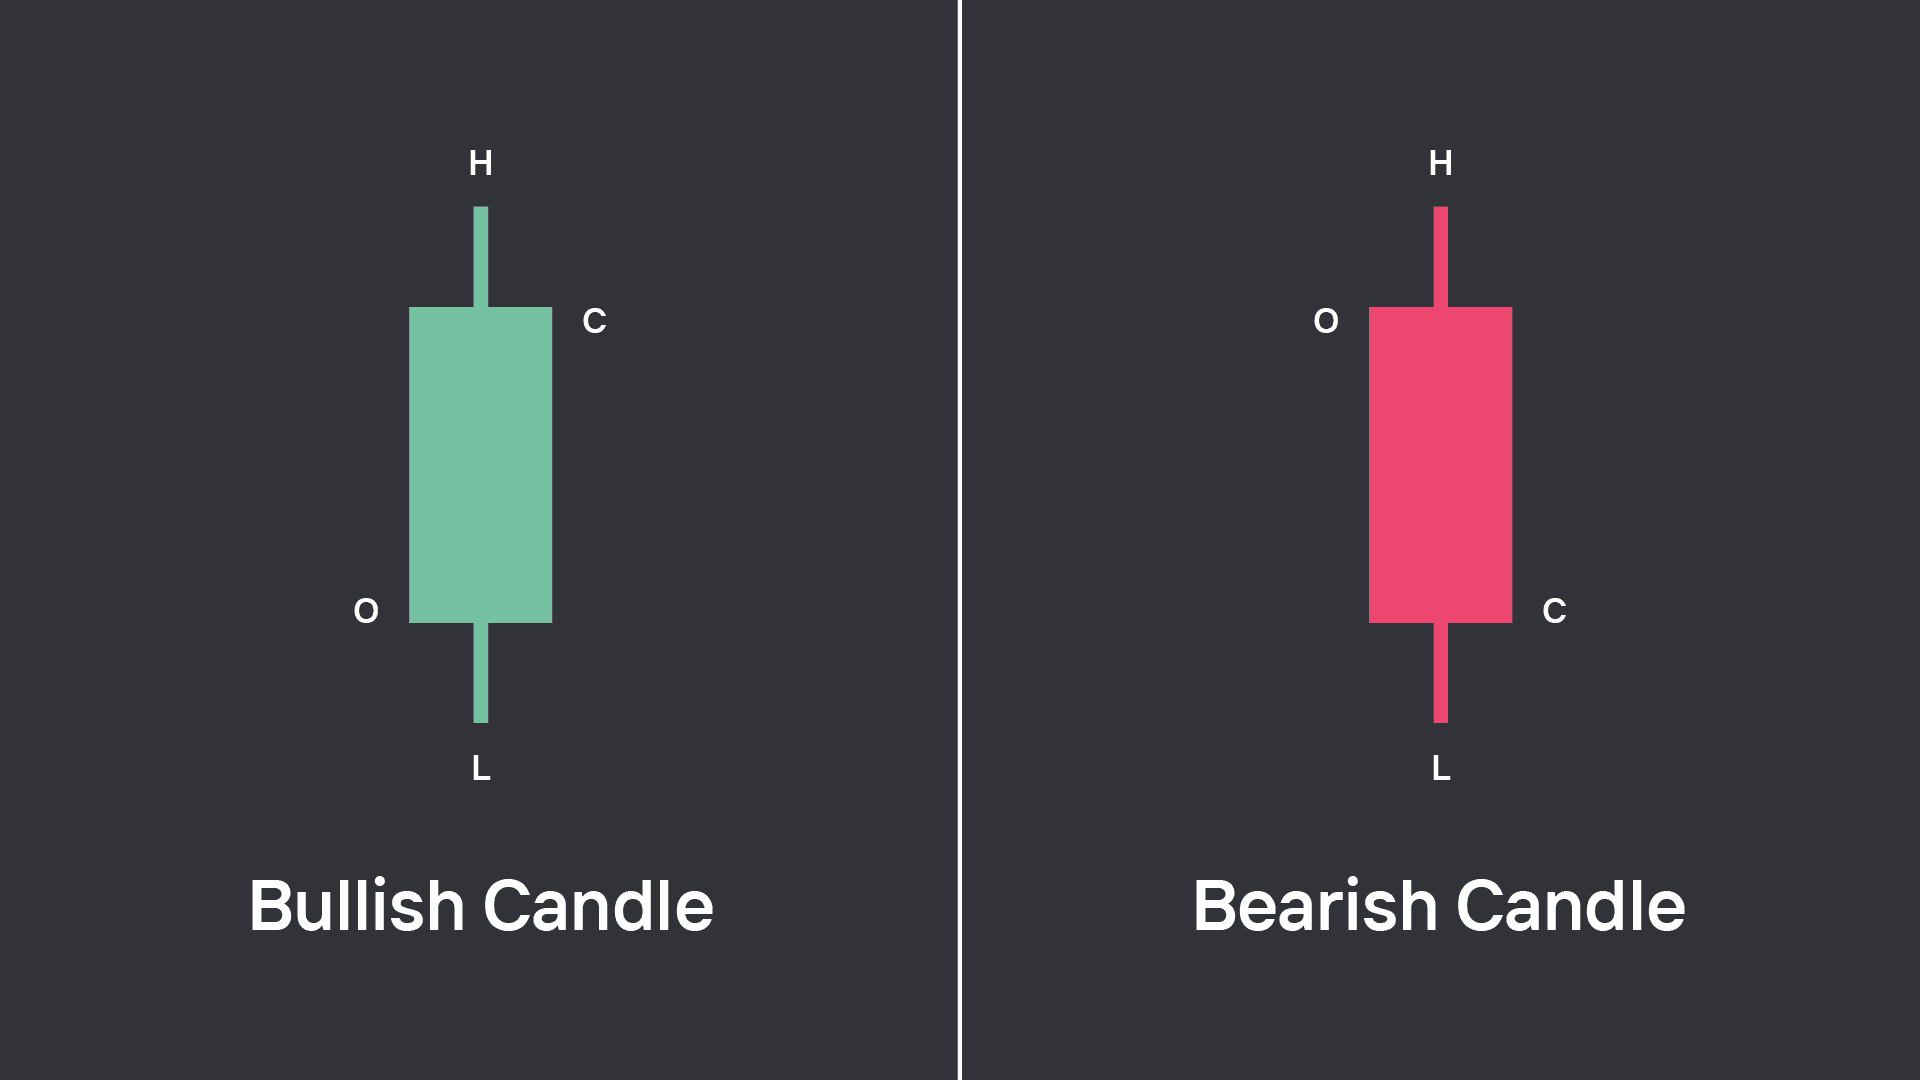
Candlesticks are used as a tool for reading the price movements of an asset on a trading chart.
Trading Basics
Chapter 1
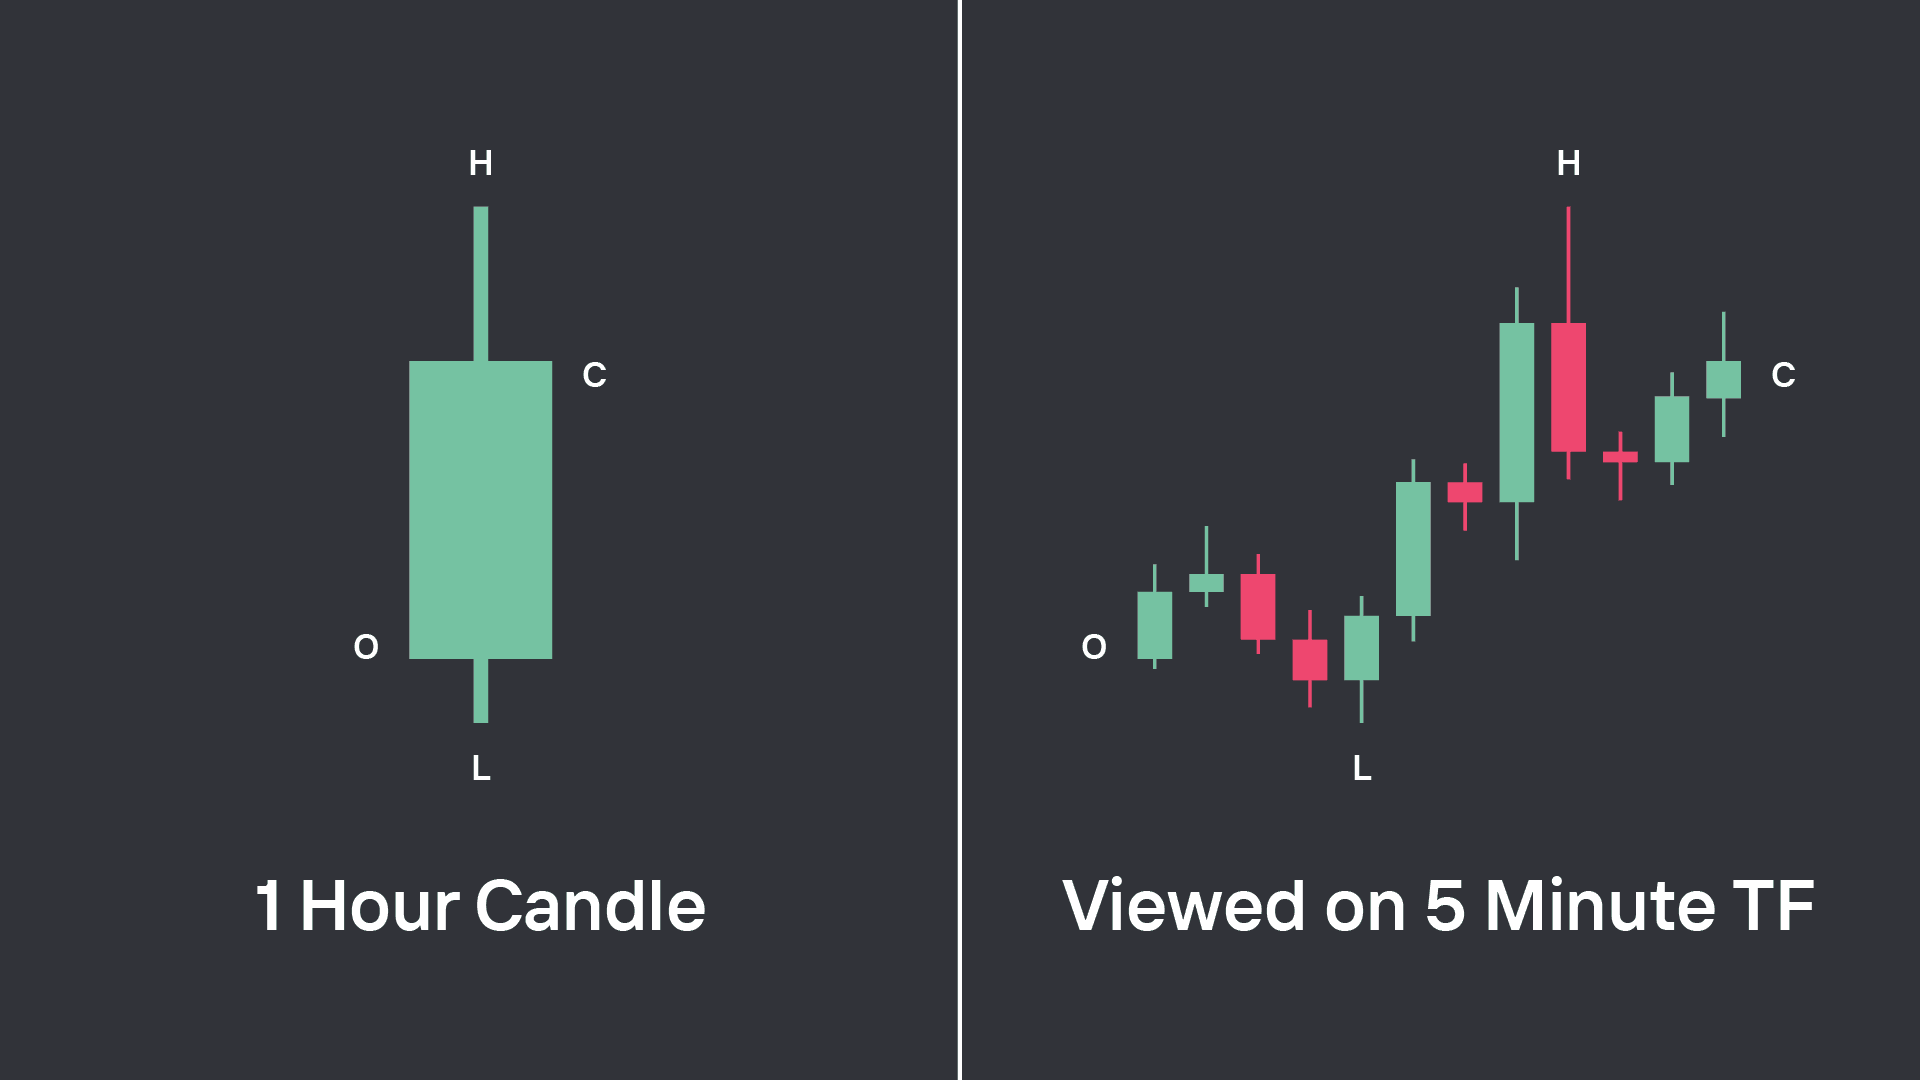
A Timeframe refers to the length of time that each candlestick represents on a candlestick chart.
Chapter 2
Swing Highs and Swing Lows are the foundation for all price action analysis strategies. They tell us where the strength between buyers and sellers reversed.
Chapter 3
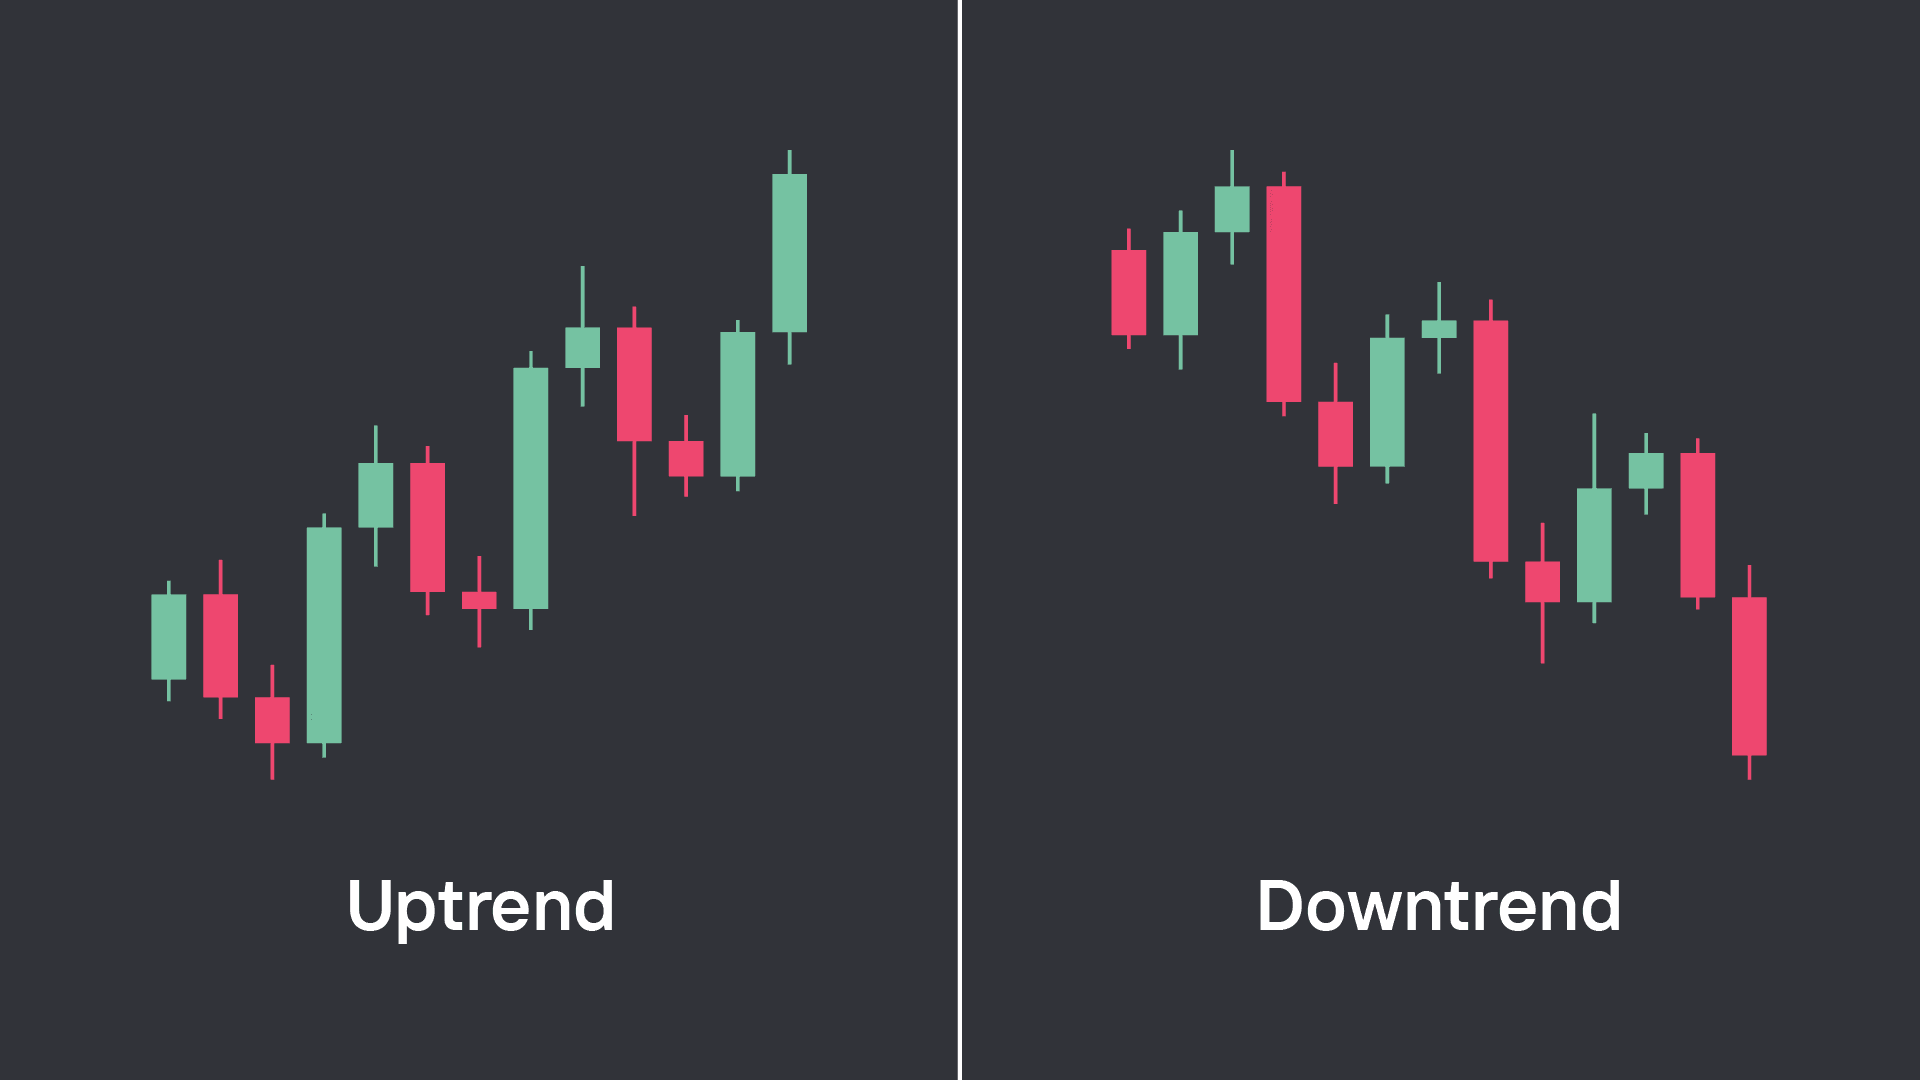
Uptrends and Downtrends are created when the market is pushing up or down with strength.
Chapter 4
Step-by-step guides for everything you need to know about trading.